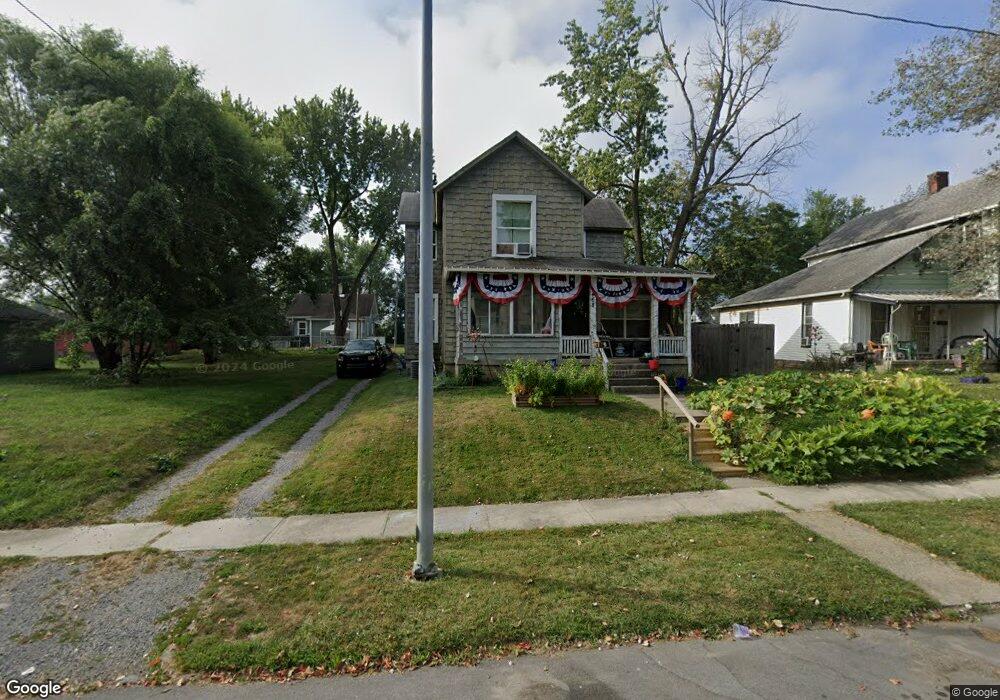
468 E Mckibben St Lima, OH 45801
Eastside Lima NeighborhoodEstimated Value: $71,534 - $138,000
4
Beds
1
Bath
1,764
Sq Ft
$58/Sq Ft
Est. Value
About This Home
This home is located at 468 E Mckibben St, Lima, OH 45801 and is currently estimated at $102,134, approximately $57 per square foot. 468 E Mckibben St is a home located in Allen County with nearby schools including Independence Elementary School, Lima North Middle School, and Lima West Middle School.
Ownership History
Date
Name
Owned For
Owner Type
Purchase Details
Closed on
Nov 17, 2015
Sold by
Mjk Real Estate Investments Llc
Bought by
Edens David S and Edens April S
Current Estimated Value
Purchase Details
Closed on
Oct 25, 2007
Sold by
Gmac Mortgage Llc
Bought by
Mjk Real Estate Investments Llc
Purchase Details
Closed on
Jun 21, 2007
Sold by
Bagley Shawn
Bought by
Gmac Mortgage Llc
Purchase Details
Closed on
Nov 21, 2000
Sold by
Pinkley Carolyn S
Bought by
Bagley Shawn
Home Financials for this Owner
Home Financials are based on the most recent Mortgage that was taken out on this home.
Original Mortgage
$53,400
Interest Rate
7.87%
Mortgage Type
New Conventional
Purchase Details
Closed on
Sep 23, 1992
Bought by
Pinkley Carolyn Sue
Create a Home Valuation Report for This Property
The Home Valuation Report is an in-depth analysis detailing your home's value as well as a comparison with similar homes in the area
Home Values in the Area
Average Home Value in this Area
Purchase History
| Date | Buyer | Sale Price | Title Company |
|---|---|---|---|
| Edens David S | $6,000 | None Available | |
| Mjk Real Estate Investments Llc | $10,100 | Sovereign Title Agency Title | |
| Gmac Mortgage Llc | $18,000 | None Available | |
| Bagley Shawn | $50,000 | -- | |
| Pinkley Carolyn Sue | $2,000 | -- |
Source: Public Records
Mortgage History
| Date | Status | Borrower | Loan Amount |
|---|---|---|---|
| Previous Owner | Bagley Shawn | $53,400 |
Source: Public Records
Tax History
| Year | Tax Paid | Tax Assessment Tax Assessment Total Assessment is a certain percentage of the fair market value that is determined by local assessors to be the total taxable value of land and additions on the property. | Land | Improvement |
|---|---|---|---|---|
| 2024 | $444 | $11,060 | $1,400 | $9,660 |
| 2023 | $478 | $10,540 | $1,330 | $9,210 |
| 2022 | $479 | $10,540 | $1,330 | $9,210 |
| 2021 | $506 | $10,540 | $1,330 | $9,210 |
| 2020 | $471 | $8,620 | $1,300 | $7,320 |
| 2019 | $471 | $8,620 | $1,300 | $7,320 |
| 2018 | $429 | $8,620 | $1,300 | $7,320 |
| 2017 | $473 | $8,620 | $1,300 | $7,320 |
| 2016 | $480 | $8,620 | $1,300 | $7,320 |
| 2015 | $600 | $8,620 | $1,300 | $7,320 |
| 2014 | $600 | $10,680 | $1,370 | $9,310 |
| 2013 | $762 | $14,320 | $1,370 | $12,950 |
Source: Public Records
Map
Nearby Homes
- 129 S Pine St
- 145 S Pine St
- 922 N Jefferson St
- 626 E Elm St
- 616-616.5 N Elizabeth St
- 217 Harrison Ave
- 124 N Perry St
- 610 Linden St
- 1210 E Market St
- 817 E Eureka St
- 735 N Elizabeth St
- 919 N Main St
- 325 N McDonel St
- 416 Hazel Ave
- 316 Ewing Ave
- 504 S Shawnee St
- 124 S Collins Ave
- 435 Marian Ave
- 471 Mc Pheron Ave
- 631 Brice Ave
- 468 E Mckibben St
- 444 E Mckibben St
- 472 E Mckibben St
- 469 E Pearl St
- 481 E Pearl St
- 485 E Pearl St
- 440 E Mckibben St
- 440 E Mckibben St
- 438 E Mckibben St
- 447 E Mckibben St
- 447 E Mckibben St
- 443 E Mckibben St
- 449 E Pearl St
- 441 E Mckibben St
- 447 E Pearl St
- 476 E Pearl St
- 436 E Mckibben St
- 486 E Pearl St
- 437 E Mckibben St
- 468 E Pearl St
Your Personal Tour Guide
Ask me questions while you tour the home.