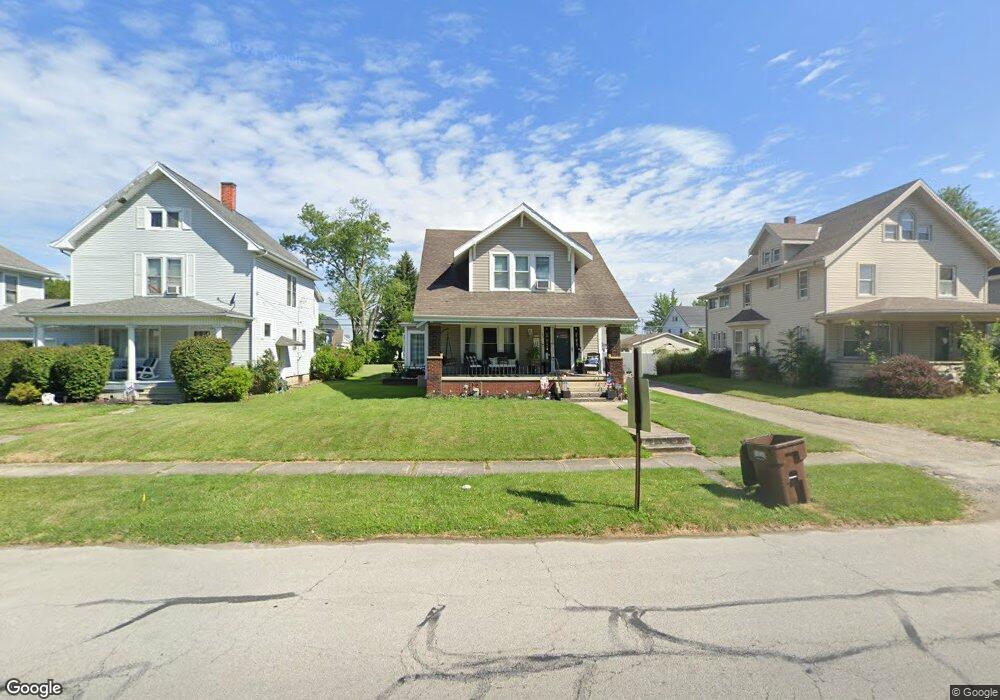
469 E Perry St Tiffin, OH 44883
Estimated Value: $125,000 - $161,000
3
Beds
2
Baths
1,467
Sq Ft
$99/Sq Ft
Est. Value
About This Home
This home is located at 469 E Perry St, Tiffin, OH 44883 and is currently estimated at $144,927, approximately $98 per square foot. 469 E Perry St is a home located in Seneca County with nearby schools including Columbian High School, Calvert High School, and Calvert Catholic Elementary School.
Ownership History
Date
Name
Owned For
Owner Type
Purchase Details
Closed on
Nov 14, 2011
Sold by
Richie Heather M and Belknap Heather M
Bought by
Richie Jason L
Current Estimated Value
Home Financials for this Owner
Home Financials are based on the most recent Mortgage that was taken out on this home.
Original Mortgage
$90,725
Outstanding Balance
$61,255
Interest Rate
4.12%
Mortgage Type
New Conventional
Estimated Equity
$83,672
Purchase Details
Closed on
Mar 27, 2001
Sold by
Windsor Jason D
Bought by
Richie Jason L
Purchase Details
Closed on
May 19, 1997
Sold by
Woods Lucille C
Bought by
Windsor Jason D
Purchase Details
Closed on
Sep 29, 1992
Sold by
Woods Albert J
Bought by
Woods Lucille C
Create a Home Valuation Report for This Property
The Home Valuation Report is an in-depth analysis detailing your home's value as well as a comparison with similar homes in the area
Home Values in the Area
Average Home Value in this Area
Purchase History
| Date | Buyer | Sale Price | Title Company |
|---|---|---|---|
| Richie Jason L | -- | First American Title Ins | |
| Richie Jason L | $79,000 | -- | |
| Windsor Jason D | $58,000 | -- | |
| Woods Lucille C | -- | -- |
Source: Public Records
Mortgage History
| Date | Status | Borrower | Loan Amount |
|---|---|---|---|
| Open | Richie Jason L | $90,725 |
Source: Public Records
Tax History
| Year | Tax Paid | Tax Assessment Tax Assessment Total Assessment is a certain percentage of the fair market value that is determined by local assessors to be the total taxable value of land and additions on the property. | Land | Improvement |
|---|---|---|---|---|
| 2025 | $1,386 | $40,880 | $5,400 | $35,480 |
| 2024 | $1,380 | $40,880 | $5,400 | $35,480 |
| 2023 | $1,381 | $40,880 | $5,400 | $35,480 |
| 2022 | $1,231 | $30,220 | $4,600 | $25,620 |
| 2021 | $1,239 | $30,220 | $4,600 | $25,620 |
| 2020 | $1,263 | $30,220 | $4,596 | $25,624 |
| 2019 | $1,249 | $28,911 | $4,505 | $24,406 |
| 2018 | $1,237 | $28,599 | $4,505 | $24,094 |
| 2017 | $1,251 | $28,599 | $4,505 | $24,094 |
| 2016 | $1,140 | $26,723 | $4,368 | $22,355 |
| 2015 | $1,127 | $26,723 | $4,368 | $22,355 |
| 2014 | $1,062 | $26,723 | $4,368 | $22,355 |
| 2013 | $1,135 | $27,542 | $4,505 | $23,037 |
Source: Public Records
Map
Nearby Homes
Your Personal Tour Guide
Ask me questions while you tour the home.