Estimated Value: $720,000 - $1,039,000
About This Home
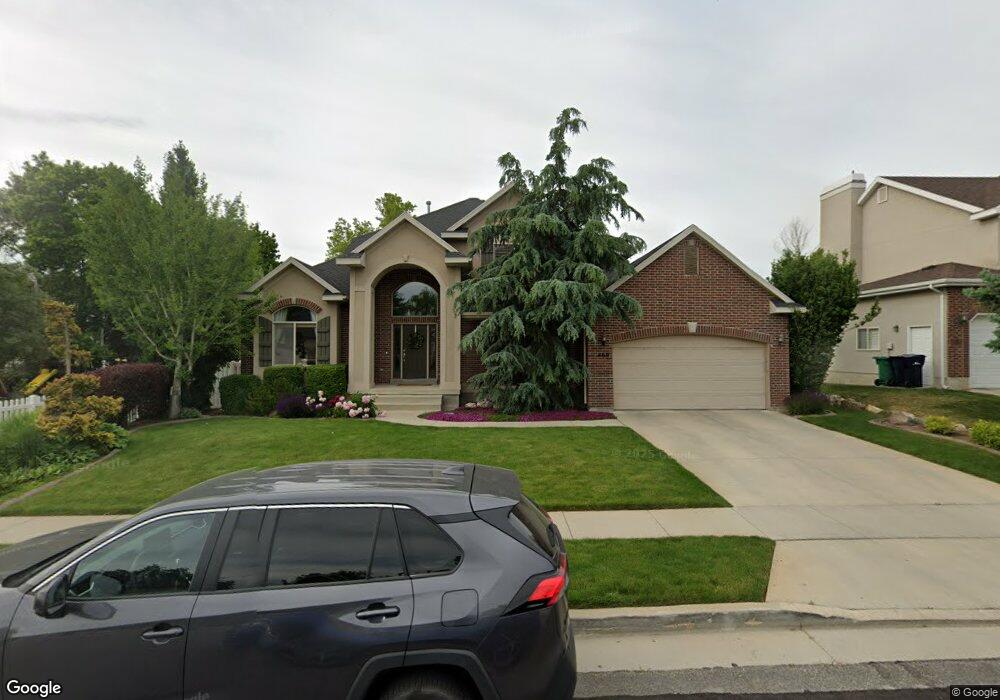
This home is located at 469 Sandy Oaks Dr, Sandy, UT 84070 and is currently estimated at $842,459, approximately $218 per square foot. 469 Sandy Oaks Dr is a home located in Salt Lake County with nearby schools including Sandy Elementary School, Mount Jordan Middle School, and Jordan High.
Ownership History
We collect this data history from publicly available records. To have your information removed, we recommend requesting removal directly through your county’s website.
Purchase Details
Purchase Details
Purchase Details
Home Financials for this Owner
Home Financials are based on the most recent Mortgage that was taken out on this home.Purchase Details
Purchase Details
Purchase Details
Purchase Details
Purchase Details
Home Financials for this Owner
Home Financials are based on the most recent Mortgage that was taken out on this home.Purchase Details
Home Values in the Area
Average Home Value in this Area
Purchase History
We collect this data history from publicly available records. To have your information removed, we recommend requesting removal directly through your county’s website.
| Date | Buyer | Sale Price | Title Company |
|---|---|---|---|
| -- | Gateway Title | ||
| -- | -- | ||
| -- | Gateway Title | ||
| -- | -- | ||
| -- | Metro National Title | ||
| -- | Accommodation | ||
| -- | Accommodation | ||
| -- | Hickman Land Title Co | ||
| -- | Hickman Land Title Co | ||
| -- | None Available | ||
| -- | Superior Title | ||
| -- | Merrill Title |
Mortgage History
We collect this data history from publicly available records. To have your information removed, we recommend requesting removal directly through your county’s website.
| Date | Status | Borrower | Loan Amount |
|---|---|---|---|
| Previous Owner | $217,200 | ||
| Previous Owner | $255,920 | ||
| Closed | $31,990 |
Tax History
We collect this data history from publicly available records. To have your information removed, we recommend requesting removal directly through your county’s website.
| Year | Tax Paid | Tax Assessment Tax Assessment Total Assessment is a certain percentage of the fair market value that is determined by local assessors to be the total taxable value of land and additions on the property. | Land | Improvement |
|---|---|---|---|---|
| 2025 | $3,689 | $693,700 | $150,700 | $543,000 |
| 2024 | $3,744 | $692,400 | $140,900 | $551,500 |
| 2023 | $3,483 | $642,200 | $133,900 | $508,300 |
| 2022 | $3,607 | $649,800 | $131,300 | $518,500 |
| 2021 | $3,365 | $516,000 | $112,200 | $403,800 |
| 2020 | $3,190 | $461,200 | $112,200 | $349,000 |
| 2019 | $3,289 | $463,400 | $105,900 | $357,500 |
| 2018 | $2,917 | $427,900 | $105,900 | $322,000 |
| 2017 | $2,897 | $406,100 | $105,900 | $300,200 |
| 2016 | $2,789 | $377,800 | $105,900 | $271,900 |
| 2015 | $2,966 | $371,900 | $102,700 | $269,200 |
| 2014 | $2,733 | $335,900 | $94,200 | $241,700 |
Map
- 359 E 8400 S
- 499 E 8575 S
- 8322 S Levine Ln Unit 111
- 416 E 8260 S
- 8260 S 560 E
- 8447 Mayfly Way
- 635 E Williamsburg Park Cir
- 246 E 8375 S
- 744 E 8425 S
- 412 E 8760 S
- 8732 S 620 E
- 144 E Chambord Ct
- 140 E Chambord Ct
- 138 E Chambord Ct
- 8076 S 300 E Unit 247
- 136 E Chambord Ct
- 132 E Chambord Ct
- 254 Water Mill Way Unit 227
- 263 Water Mill Way Unit 210
- 8780 S 250 E
- 479 E Sandy Oaks Dr
- 479 Sandy Oaks Dr
- 460 E 8400 S
- 474 E 8400 S
- 489 E Sandy Oaks Dr
- 489 Sandy Oaks Dr
- 470 Sandy Oaks Dr
- 470 E Sandy Hollow Cir
- 460 Sandy Oaks Dr
- 480 E Sandy Oaks Dr
- 480 Sandy Oaks Dr
- 446 E 8400 S
- 488 E 8400 S
- 450 E Sandy Oaks Dr
- 450 Sandy Oaks Dr
- 490 E Sandy Oaks Dr
- 490 Sandy Oaks Dr
- 439 Sandy Oaks Dr
- 436 E 8400 S
- 501 E Sandy Oaks Dr
Ask me questions while you tour the home.