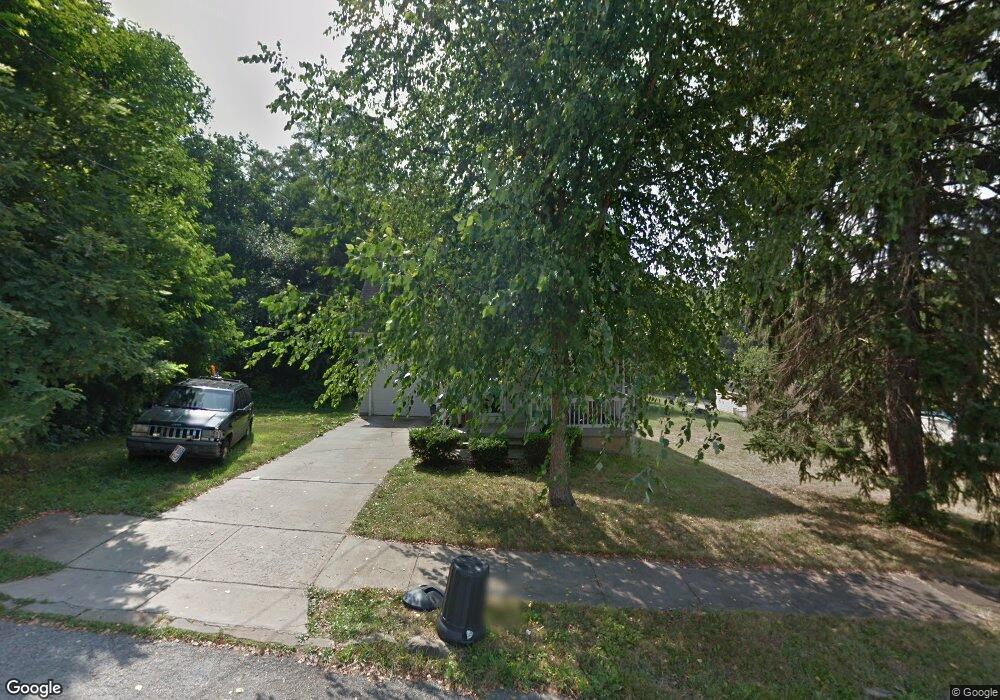
47 7th St Campbell, OH 44405
Estimated Value: $94,000 - $121,000
4
Beds
2
Baths
1,296
Sq Ft
$85/Sq Ft
Est. Value
About This Home
This home is located at 47 7th St, Campbell, OH 44405 and is currently estimated at $110,667, approximately $85 per square foot. 47 7th St is a home located in Mahoning County with nearby schools including Campbell Elementary School, Memorial High School, and Northeast Ohio Impact Academy.
Ownership History
Date
Name
Owned For
Owner Type
Purchase Details
Closed on
Sep 8, 2015
Sold by
Common Wealth Inc
Bought by
Scboyz Llc
Current Estimated Value
Home Financials for this Owner
Home Financials are based on the most recent Mortgage that was taken out on this home.
Original Mortgage
$378,250
Outstanding Balance
$293,599
Interest Rate
3.97%
Mortgage Type
Future Advance Clause Open End Mortgage
Estimated Equity
-$182,932
Purchase Details
Closed on
Nov 7, 1988
Bought by
St Vincent Depaul Society
Create a Home Valuation Report for This Property
The Home Valuation Report is an in-depth analysis detailing your home's value as well as a comparison with similar homes in the area
Home Values in the Area
Average Home Value in this Area
Purchase History
| Date | Buyer | Sale Price | Title Company |
|---|---|---|---|
| Scboyz Llc | $445,000 | Attorney | |
| St Vincent Depaul Society | -- | -- |
Source: Public Records
Mortgage History
| Date | Status | Borrower | Loan Amount |
|---|---|---|---|
| Open | Scboyz Llc | $378,250 |
Source: Public Records
Tax History
| Year | Tax Paid | Tax Assessment Tax Assessment Total Assessment is a certain percentage of the fair market value that is determined by local assessors to be the total taxable value of land and additions on the property. | Land | Improvement |
|---|---|---|---|---|
| 2025 | $1,412 | $26,310 | $340 | $25,970 |
| 2024 | $1,412 | $26,310 | $340 | $25,970 |
| 2023 | $1,396 | $26,310 | $340 | $25,970 |
| 2022 | $578 | $9,100 | $340 | $8,760 |
| 2021 | $543 | $9,100 | $340 | $8,760 |
| 2020 | $551 | $9,100 | $340 | $8,760 |
| 2019 | $526 | $7,700 | $340 | $7,360 |
| 2018 | $539 | $7,700 | $340 | $7,360 |
| 2017 | $536 | $7,700 | $340 | $7,360 |
| 2016 | $774 | $7,780 | $340 | $7,440 |
| 2015 | $759 | $11,830 | $340 | $11,490 |
| 2014 | $757 | $11,830 | $340 | $11,490 |
| 2013 | $742 | $11,830 | $340 | $11,490 |
Source: Public Records
Map
Nearby Homes
- 190 10th St
- 114 Penhale Ave
- 130 12th St
- 374 Tenney Ave
- 459 Tenney Ave
- 412 Whipple Ave
- 321 Porter Ave
- 330 Sanderson Ave
- 0 Penhale Ave
- 279 Coitsville Rd
- 204 Tremble Ave
- 377 Coitsville Rd
- 664 Tenney Ave
- 3563 Valerie Dr
- 127 Blackburn St
- 3516 Champlain Ave
- 151 Regent St
- 214 Hamrock Dr
- 3443 Belden Ave
- 687 Moore Ave
Your Personal Tour Guide
Ask me questions while you tour the home.