47 Chilson St Springfield, MA 01118
East Forest Park NeighborhoodEstimated Value: $266,000 - $302,000
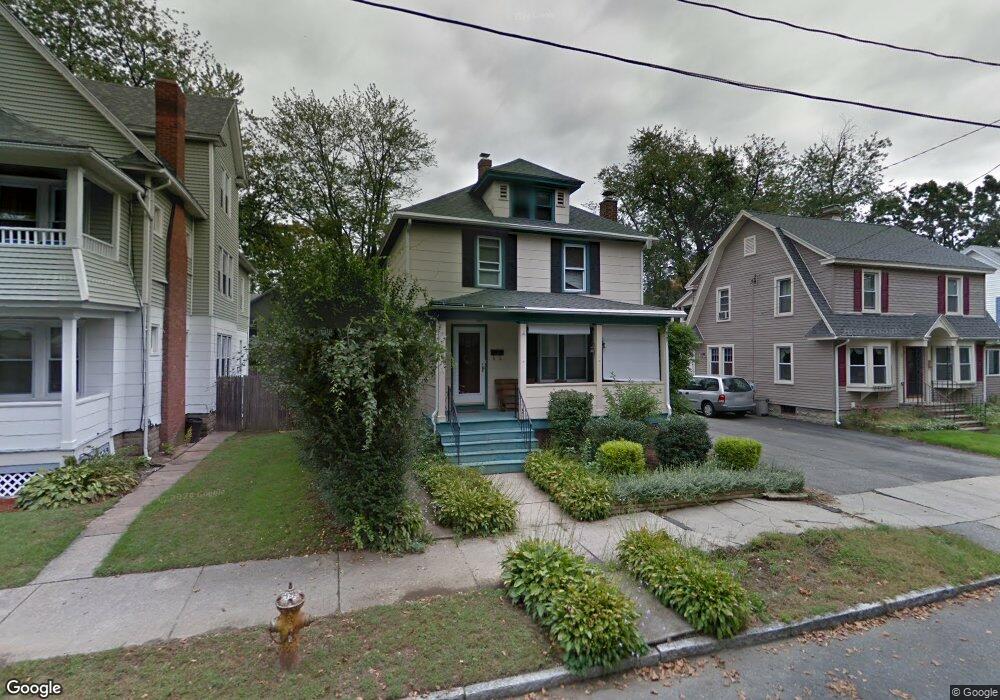
About This Home
This home is located at 47 Chilson St, Springfield, MA 01118 and is currently estimated at $289,934, approximately $189 per square foot. 47 Chilson St is a home located in Hampden County with nearby schools including Frederick Harris Elementary School, M Marcus Kiley Middle, and High School Of Commerce.
Ownership History
We collect this data history from publicly available records. To have your information removed, we recommend requesting removal directly through your county’s website.
Purchase Details
Purchase Details
Purchase Details
Home Financials for this Owner
Home Financials are based on the most recent Mortgage that was taken out on this home.Home Values in the Area
Average Home Value in this Area
Purchase History
We collect this data history from publicly available records. To have your information removed, we recommend requesting removal directly through your county’s website.
| Date | Buyer | Sale Price | Title Company |
|---|---|---|---|
| -- | -- | ||
| -- | -- | ||
| $63,000 | -- |
Mortgage History
We collect this data history from publicly available records. To have your information removed, we recommend requesting removal directly through your county’s website.
| Date | Status | Borrower | Loan Amount |
|---|---|---|---|
| Previous Owner | $27,667 | ||
| Previous Owner | $73,000 | ||
| Previous Owner | $59,850 | ||
| Previous Owner | $7,000 |
Tax History
We collect this data history from publicly available records. To have your information removed, we recommend requesting removal directly through your county’s website.
| Year | Tax Paid | Tax Assessment Tax Assessment Total Assessment is a certain percentage of the fair market value that is determined by local assessors to be the total taxable value of land and additions on the property. | Land | Improvement |
|---|---|---|---|---|
| 2025 | $3,780 | $241,100 | $36,800 | $204,300 |
| 2024 | $3,935 | $245,000 | $36,800 | $208,200 |
| 2023 | $3,451 | $202,400 | $35,100 | $167,300 |
| 2022 | $3,504 | $186,200 | $35,100 | $151,100 |
| 2021 | $3,251 | $172,000 | $31,900 | $140,100 |
| 2020 | $2,978 | $152,500 | $31,900 | $120,600 |
| 2019 | $3,027 | $153,800 | $31,900 | $121,900 |
| 2018 | $2,976 | $151,200 | $31,900 | $119,300 |
| 2017 | $2,684 | $136,500 | $30,500 | $106,000 |
| 2016 | $2,534 | $128,900 | $30,500 | $98,400 |
| 2015 | $2,506 | $127,400 | $30,500 | $96,900 |
Map
- 28 Bither St
- 57 Bither St
- 1043 Sumner Ave
- 34 Castle St
- 47 Thorndyke St
- 54 Thorndyke St
- 107 Dorset St
- 120-122 Larkspur St
- 60 Rencelau St
- 84 Wheeler Ave
- es Eddywood St
- 75 Garland St
- 109 Eddywood St
- 79 Roosevelt Ave
- 119 Powell Ave
- 850-852 Sumner Ave
- 51 Hartford Terrace
- 163 Powell Ave
- 217 Ellsworth Ave
- 24 Hiawatha St
- 48 Howes St Unit 50
- 54 Howes St
- 44 Howes St
- 60 Howes St Unit 1
- 60 Howes St Unit 2
- 58 Howes St Unit 60
- 58 Howes St Unit 2
- 58 Howes St Unit 1
- 58-60 Howes St
- 38 Howes St
- 41 Chilson St Unit 43
- 57 Chilson St
- 37 Chilson St
- 62 Howes St Unit 64
- 47-49 Howes St
- 47 Howes St Unit 49
- 51 Howes St Unit 53
- 51-53 Howes St
- 41 Howes St Unit 43
- 32 Howes St
Ask me questions while you tour the home.