47 Dunbar Ave Rumford, RI 02916
Carpenters Corner NeighborhoodEstimated Value: $441,097 - $637,000
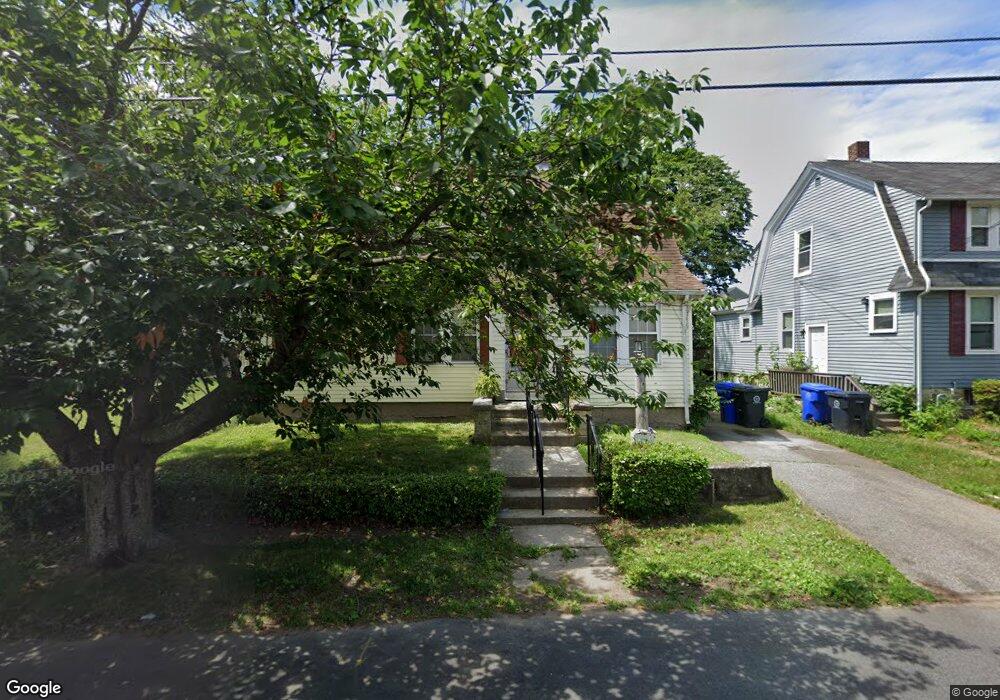
About This Home
This home is located at 47 Dunbar Ave, Rumford, RI 02916 and is currently estimated at $525,274, approximately $306 per square foot. 47 Dunbar Ave is a home located in Providence County with nearby schools including East Providence High School, St Margaret School, and Ocean State Montessori School.
Ownership History
We collect this data history from publicly available records. To have your information removed, we recommend requesting removal directly through your county’s website.
Purchase Details
Home Financials for this Owner
Home Financials are based on the most recent Mortgage that was taken out on this home.Home Values in the Area
Average Home Value in this Area
Purchase History
We collect this data history from publicly available records. To have your information removed, we recommend requesting removal directly through your county’s website.
| Date | Buyer | Sale Price | Title Company |
|---|---|---|---|
| $120,000 | -- | ||
| $120,000 | -- |
Mortgage History
We collect this data history from publicly available records. To have your information removed, we recommend requesting removal directly through your county’s website.
| Date | Status | Borrower | Loan Amount |
|---|---|---|---|
| Open | $129,500 | ||
| Closed | $138,000 | ||
| Closed | $104,346 |
Tax History
We collect this data history from publicly available records. To have your information removed, we recommend requesting removal directly through your county’s website.
| Year | Tax Paid | Tax Assessment Tax Assessment Total Assessment is a certain percentage of the fair market value that is determined by local assessors to be the total taxable value of land and additions on the property. | Land | Improvement |
|---|---|---|---|---|
| 2025 | $5,648 | $432,100 | $116,800 | $315,300 |
| 2024 | $5,436 | $354,600 | $102,600 | $252,000 |
| 2023 | $5,234 | $354,600 | $102,600 | $252,000 |
| 2022 | $4,866 | $222,600 | $48,600 | $174,000 |
| 2021 | $4,786 | $222,600 | $48,600 | $174,000 |
| 2020 | $4,583 | $222,600 | $48,600 | $174,000 |
| 2019 | $4,456 | $222,600 | $48,600 | $174,000 |
| 2018 | $4,844 | $211,700 | $49,300 | $162,400 |
| 2017 | $4,736 | $211,700 | $49,300 | $162,400 |
| 2016 | $4,712 | $211,700 | $49,300 | $162,400 |
| 2015 | $4,758 | $207,300 | $45,700 | $161,600 |
| 2014 | $4,758 | $207,300 | $45,700 | $161,600 |
Map
- 42 Dunbar Ave
- 60 Centre St
- 435 N Broadway
- 120 Hobson Ave
- 353 Massasoit Ave
- 28 Orlo Ave
- 69 Roger Williams Ave
- 21 Washburn Ave Unit 23
- 24 Huntington Dr
- 1467 Pawtucket Ave
- 47 Goldsmith Ave
- 2 Duncan Rd
- 100 Hope St
- 324 Pleasant St
- 1335 Pawtucket Ave
- 0 Newman Ave Rear
- 15 Cooper St
- 172 Central Ave
- 59 Bourne Ave
- 0 Pleasant St
Ask me questions while you tour the home.