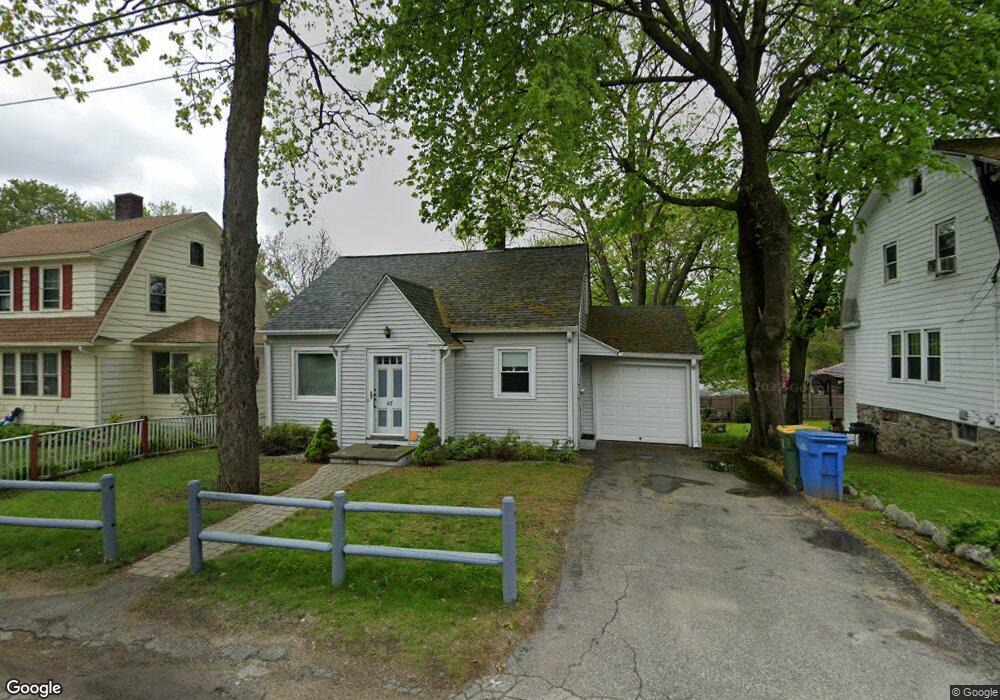
47 Eldridge St Waterbury, CT 06704
North End District NeighborhoodEstimated Value: $249,000 - $280,000
3
Beds
2
Baths
1,124
Sq Ft
$235/Sq Ft
Est. Value
About This Home
This home is located at 47 Eldridge St, Waterbury, CT 06704 and is currently estimated at $264,446, approximately $235 per square foot. 47 Eldridge St is a home located in New Haven County with nearby schools including F. J. Kingsbury School, North End Middle School, and Wilby High School.
Ownership History
Date
Name
Owned For
Owner Type
Purchase Details
Closed on
Dec 17, 1997
Sold by
Gross Belle S
Bought by
Blue Ernest L
Current Estimated Value
Home Financials for this Owner
Home Financials are based on the most recent Mortgage that was taken out on this home.
Original Mortgage
$77,198
Outstanding Balance
$17,520
Interest Rate
7.14%
Mortgage Type
Purchase Money Mortgage
Estimated Equity
$246,926
Create a Home Valuation Report for This Property
The Home Valuation Report is an in-depth analysis detailing your home's value as well as a comparison with similar homes in the area
Home Values in the Area
Average Home Value in this Area
Purchase History
| Date | Buyer | Sale Price | Title Company |
|---|---|---|---|
| Blue Ernest L | $77,500 | -- |
Source: Public Records
Mortgage History
| Date | Status | Borrower | Loan Amount |
|---|---|---|---|
| Open | Blue Ernest L | $77,198 |
Source: Public Records
Tax History
| Year | Tax Paid | Tax Assessment Tax Assessment Total Assessment is a certain percentage of the fair market value that is determined by local assessors to be the total taxable value of land and additions on the property. | Land | Improvement |
|---|---|---|---|---|
| 2025 | $4,446 | $98,840 | $19,600 | $79,240 |
| 2024 | $4,887 | $98,840 | $19,600 | $79,240 |
| 2023 | $5,356 | $98,840 | $19,600 | $79,240 |
| 2022 | $3,508 | $58,260 | $19,600 | $38,660 |
| 2021 | $3,508 | $58,260 | $19,600 | $38,660 |
| 2020 | $3,508 | $58,260 | $19,600 | $38,660 |
| 2019 | $3,508 | $58,260 | $19,600 | $38,660 |
| 2018 | $3,508 | $58,260 | $19,600 | $38,660 |
| 2017 | $3,766 | $62,540 | $19,600 | $42,940 |
| 2016 | $3,766 | $62,540 | $19,600 | $42,940 |
| 2015 | $3,641 | $62,540 | $19,600 | $42,940 |
| 2014 | $3,641 | $62,540 | $19,600 | $42,940 |
Source: Public Records
Map
Nearby Homes
- 40 Houston St
- 40 Robert St
- 227 Fanning St
- 257 Cooke St
- 124 Williamson Dr
- 0 Lonsdale St
- 905 Cooke St
- 265 Citizens Ave
- 15 Kenneth Cir
- 54 Woodstock St
- 61 Nottingham Terrace
- 578 Columbia Boulevard Extension
- 577 Columbia Boulevard Extension
- 37 Byrneside Ave
- 0 Hauser St Unit 24155063
- 484 Waterville St
- 37 Clifton Ave
- 121 Hillview Ave
- 16 Clifton Ave
- 0 Farmwood Rd
Your Personal Tour Guide
Ask me questions while you tour the home.