47 Grant Ct Norwich, CT 06360
Central Norwich NeighborhoodEstimated Value: $342,000 - $398,000
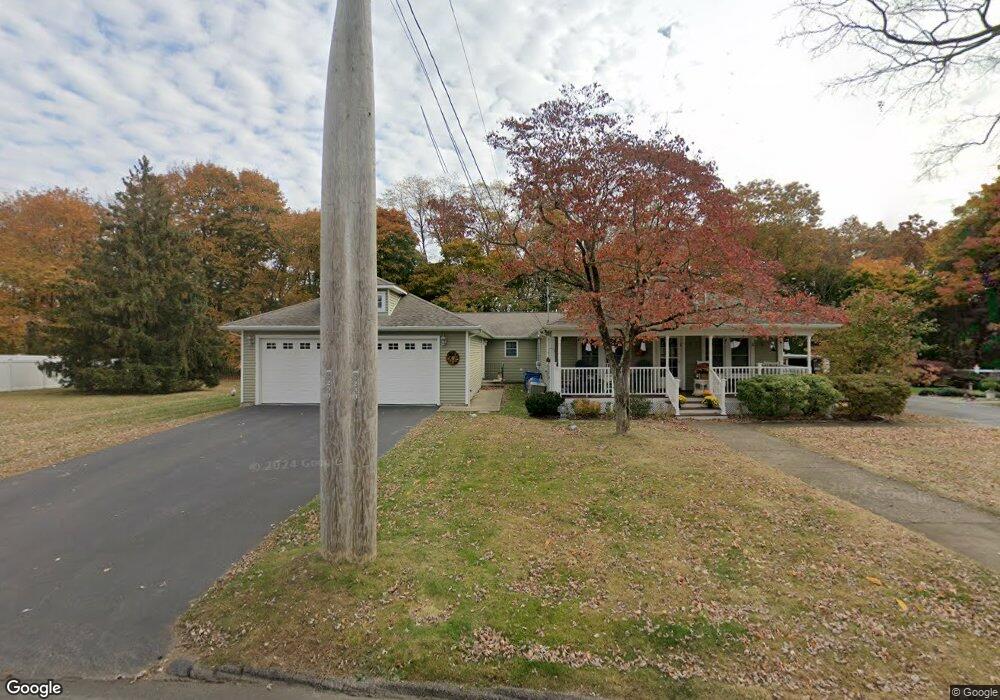
About This Home
This home is located at 47 Grant Ct, Norwich, CT 06360 and is currently estimated at $370,280, approximately $139 per square foot. 47 Grant Ct is a home located in New London County with nearby schools including John B. Stanton Elementary School, Teachers' Memorial Global Studies Magnet Middle, and Montessori Discovery School.
Ownership History
We collect this data history from publicly available records. To have your information removed, we recommend requesting removal directly through your county’s website.
Purchase Details
Home Financials for this Owner
Home Financials are based on the most recent Mortgage that was taken out on this home.Home Values in the Area
Average Home Value in this Area
Purchase History
We collect this data history from publicly available records. To have your information removed, we recommend requesting removal directly through your county’s website.
| Date | Buyer | Sale Price | Title Company |
|---|---|---|---|
| $89,000 | -- | ||
| $89,000 | -- |
Mortgage History
We collect this data history from publicly available records. To have your information removed, we recommend requesting removal directly through your county’s website.
| Date | Status | Borrower | Loan Amount |
|---|---|---|---|
| Open | $92,850 | ||
| Closed | $96,000 | ||
| Closed | $80,000 |
Tax History
We collect this data history from publicly available records. To have your information removed, we recommend requesting removal directly through your county’s website.
| Year | Tax Paid | Tax Assessment Tax Assessment Total Assessment is a certain percentage of the fair market value that is determined by local assessors to be the total taxable value of land and additions on the property. | Land | Improvement |
|---|---|---|---|---|
| 2025 | $10,882 | $268,900 | $55,200 | $213,700 |
| 2024 | $10,272 | $268,900 | $55,200 | $213,700 |
| 2023 | $8,040 | $165,300 | $32,000 | $133,300 |
| 2022 | $8,014 | $165,300 | $32,000 | $133,300 |
| 2021 | $0 | $165,300 | $32,000 | $133,300 |
| 2020 | $0 | $165,200 | $31,900 | $133,300 |
| 2019 | $7,928 | $165,200 | $31,900 | $133,300 |
| 2018 | $6,552 | $135,400 | $27,400 | $108,000 |
| 2017 | $6,599 | $135,400 | $27,400 | $108,000 |
| 2016 | $6,643 | $135,400 | $27,400 | $108,000 |
| 2015 | $6,507 | $135,400 | $27,400 | $108,000 |
| 2014 | $6,219 | $135,400 | $27,400 | $108,000 |
Map
- 123 Asylum St
- 118 Asylum St
- 46 Pearl St
- 6 Willey St
- 21 Fairmount St
- 59 Newton St
- 40 Maple Grove Ave
- 54 Alice St
- 10 Goldberg Ave
- 22 Goldberg Ave
- 69 Alice Street Extension
- 15 Elizabeth St
- 23 Sturtevant Ave
- 14 Sturtevant Ave
- 24 John St
- 21 Buckingham Ave
- 67 Peck St
- 22 Fountain St
- 7 Broad St
- 9 Washington St
Ask me questions while you tour the home.