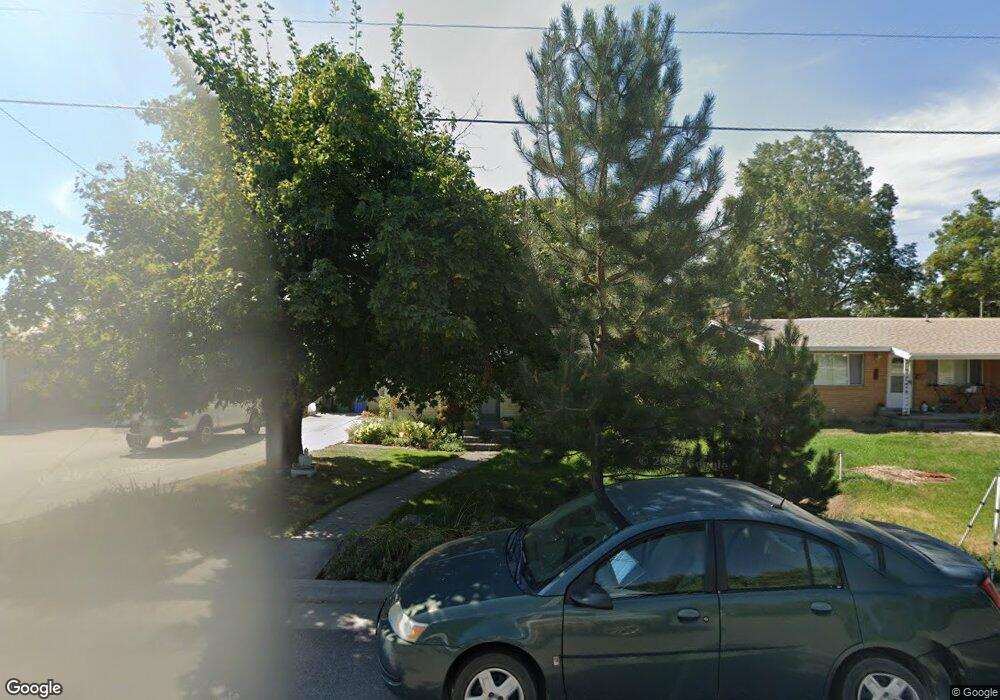
47 N 200 E Smithfield, UT 84335
Estimated Value: $242,356 - $323,000
Studio
--
Bath
675
Sq Ft
$421/Sq Ft
Est. Value
About This Home
This home is located at 47 N 200 E, Smithfield, UT 84335 and is currently estimated at $283,839, approximately $420 per square foot. 47 N 200 E is a home with nearby schools including Summit School, North Cache Middle School, and White Pine Middle School.
Ownership History
Date
Name
Owned For
Owner Type
Purchase Details
Closed on
Jul 9, 2015
Sold by
Layne Cynthia
Bought by
Richardson Chris G and Layne Cynthia
Current Estimated Value
Home Financials for this Owner
Home Financials are based on the most recent Mortgage that was taken out on this home.
Original Mortgage
$84,757
Outstanding Balance
$31,489
Interest Rate
3.3%
Mortgage Type
FHA
Estimated Equity
$252,350
Purchase Details
Closed on
Sep 8, 2006
Sold by
Roe Kenneth V and Roe Judith T
Bought by
Layne Cynthia
Home Financials for this Owner
Home Financials are based on the most recent Mortgage that was taken out on this home.
Original Mortgage
$70,655
Interest Rate
10%
Mortgage Type
Seller Take Back
Create a Home Valuation Report for This Property
The Home Valuation Report is an in-depth analysis detailing your home's value as well as a comparison with similar homes in the area
Home Values in the Area
Average Home Value in this Area
Purchase History
| Date | Buyer | Sale Price | Title Company |
|---|---|---|---|
| Richardson Chris G | -- | Pinnacle Title Ins Agency | |
| Layne Cynthia | -- | Northern Title Company |
Source: Public Records
Mortgage History
| Date | Status | Borrower | Loan Amount |
|---|---|---|---|
| Open | Richardson Chris G | $84,757 | |
| Closed | Layne Cynthia | $70,655 |
Source: Public Records
Tax History
| Year | Tax Paid | Tax Assessment Tax Assessment Total Assessment is a certain percentage of the fair market value that is determined by local assessors to be the total taxable value of land and additions on the property. | Land | Improvement |
|---|---|---|---|---|
| 2025 | $984 | $131,770 | $0 | $0 |
| 2024 | $1,213 | $152,350 | $0 | $0 |
| 2023 | $1,282 | $152,295 | $0 | $0 |
| 2022 | $107 | $125,520 | $0 | $0 |
| 2021 | $1,041 | $185,900 | $65,000 | $120,900 |
| 2020 | $949 | $158,000 | $65,000 | $93,000 |
| 2019 | $858 | $136,250 | $43,250 | $93,000 |
| 2018 | $649 | $99,698 | $43,250 | $56,448 |
| 2017 | $614 | $51,510 | $0 | $0 |
| 2016 | $625 | $51,510 | $0 | $0 |
| 2015 | $627 | $51,510 | $0 | $0 |
| 2014 | $615 | $51,505 | $0 | $0 |
| 2013 | $448 | $48,210 | $0 | $0 |
Source: Public Records
Map
Nearby Homes
Your Personal Tour Guide
Ask me questions while you tour the home.