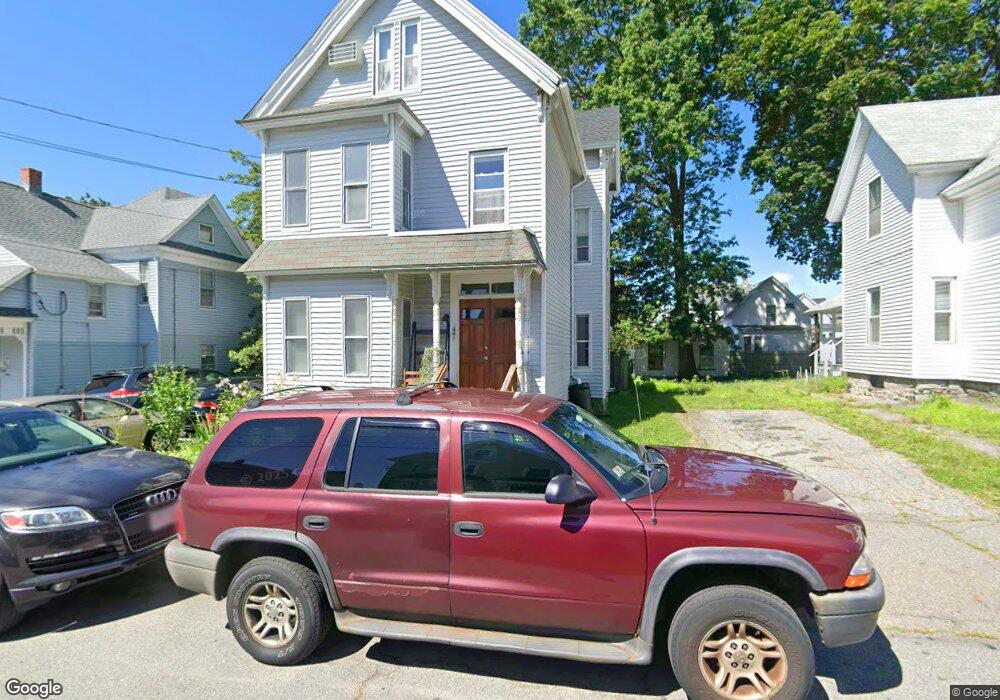
47 S Loring St Lowell, MA 01851
Lower Highlands NeighborhoodEstimated Value: $592,427 - $655,000
6
Beds
2
Baths
2,689
Sq Ft
$233/Sq Ft
Est. Value
About This Home
This home is located at 47 S Loring St, Lowell, MA 01851 and is currently estimated at $625,857, approximately $232 per square foot. 47 S Loring St is a home located in Middlesex County with nearby schools including Charles W. Morey Elementary School, Abraham Lincoln Elementary School, and Dr. Gertrude Bailey Elementary School.
Ownership History
Date
Name
Owned For
Owner Type
Purchase Details
Closed on
Nov 18, 2008
Sold by
Pelletier David G and Bank Of New York Mello
Bought by
Bank Of New York Mello
Current Estimated Value
Purchase Details
Closed on
Jan 10, 2008
Sold by
Pelletier Denise L and Pelletier David G
Bought by
Bank Of New York
Purchase Details
Closed on
May 15, 1988
Sold by
Shea Wm J
Bought by
Pelletier David G
Create a Home Valuation Report for This Property
The Home Valuation Report is an in-depth analysis detailing your home's value as well as a comparison with similar homes in the area
Home Values in the Area
Average Home Value in this Area
Purchase History
We collect this data history from publicly available records. To have your information removed, we recommend requesting removal directly through your county’s website.
| Date | Buyer | Sale Price | Title Company |
|---|---|---|---|
| Bank Of New York Mello | -- | -- | |
| Nuon Visith | $140,000 | -- | |
| Bank Of New York Mello | -- | -- | |
| Bank Of New York | $193,500 | -- | |
| Bank Of New York | $193,500 | -- | |
| Pelletier David G | $140,000 | -- |
Source: Public Records
Mortgage History
We collect this data history from publicly available records. To have your information removed, we recommend requesting removal directly through your county’s website.
| Date | Status | Borrower | Loan Amount |
|---|---|---|---|
| Open | Pelletier David G | $50,000 | |
| Previous Owner | Pelletier David G | $89,850 |
Source: Public Records
Tax History
| Year | Tax Paid | Tax Assessment Tax Assessment Total Assessment is a certain percentage of the fair market value that is determined by local assessors to be the total taxable value of land and additions on the property. | Land | Improvement |
|---|---|---|---|---|
| 2025 | $6,338 | $552,100 | $151,500 | $400,600 |
| 2024 | $5,839 | $490,300 | $136,300 | $354,000 |
| 2023 | $5,423 | $436,600 | $118,500 | $318,100 |
| 2022 | $5,016 | $395,300 | $107,700 | $287,600 |
| 2021 | $4,650 | $345,500 | $93,700 | $251,800 |
| 2020 | $4,194 | $313,900 | $81,900 | $232,000 |
| 2019 | $3,920 | $279,200 | $75,800 | $203,400 |
| 2018 | $3,613 | $251,100 | $69,000 | $182,100 |
| 2017 | $3,414 | $228,800 | $62,700 | $166,100 |
| 2016 | $3,423 | $225,800 | $59,700 | $166,100 |
| 2015 | $3,176 | $205,200 | $61,100 | $144,100 |
| 2013 | $2,933 | $195,400 | $73,100 | $122,300 |
Source: Public Records
Map
Nearby Homes
- 67 S Loring St
- 122 S Walker St
- 252 Shaw St
- 710 School St
- 42 D St
- 170 Warwick St
- 137 Pine St Unit 29
- 446 Westford St Unit 1
- 68 Liberty St
- 27 Shaw St
- 312 Wilder St
- 23 Houghton St
- 17 Wedge St
- 525 Chelmsford St
- 237 Branch St
- 305 Pine St Unit 12
- 1036 Middlesex St Unit 9
- 1045 Middlesex St
- 75 Plain St
- 19 Sheldon St
Your Personal Tour Guide
Ask me questions while you tour the home.