Estimated Value: $276,000 - $412,000
2
Beds
2
Baths
1,134
Sq Ft
$316/Sq Ft
Est. Value
About This Home
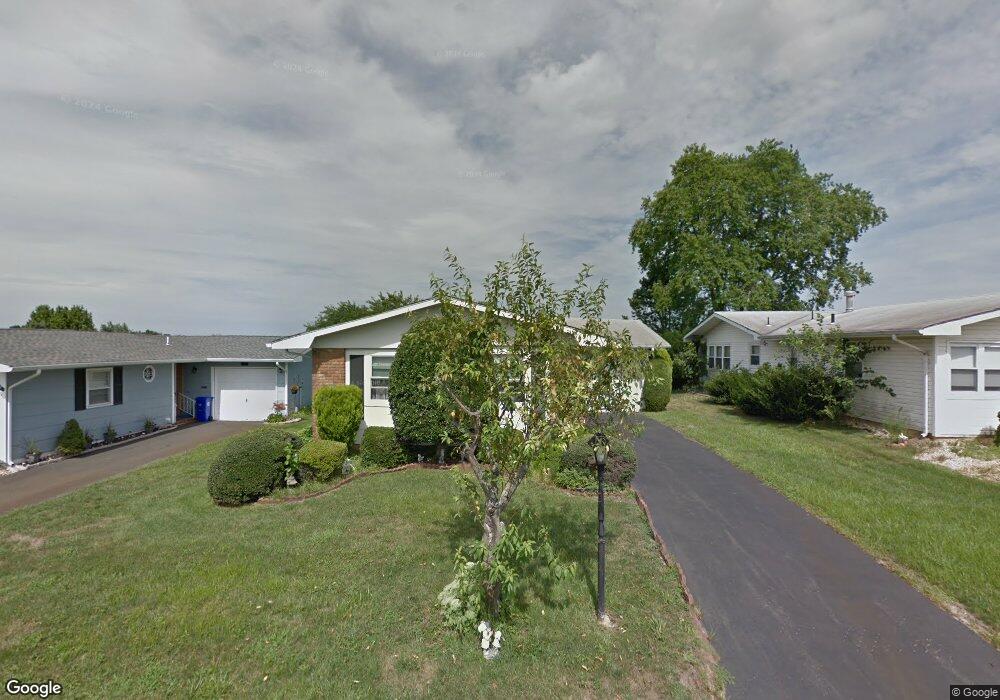
This home is located at 47 Sidney Ct, Brick, NJ 08724 and is currently estimated at $358,379, approximately $316 per square foot. 47 Sidney Ct is a home located in Ocean County with nearby schools including Lanes Mill Elementary School, Veterans Memorial Middle School, and Brick Township Memorial High School.
Ownership History
Date
Name
Owned For
Owner Type
Purchase Details
Closed on
Oct 1, 2024
Sold by
Sheridan Catherine
Bought by
Ilgandi Edward M and Ilgandi Salvador Mary
Current Estimated Value
Purchase Details
Closed on
Oct 11, 2002
Sold by
Macneill Jay
Bought by
Sheridan Catherine
Home Financials for this Owner
Home Financials are based on the most recent Mortgage that was taken out on this home.
Original Mortgage
$145,000
Interest Rate
6.34%
Purchase Details
Closed on
Dec 3, 1994
Sold by
Petersen Paul
Bought by
Macneill Harriet
Create a Home Valuation Report for This Property
The Home Valuation Report is an in-depth analysis detailing your home's value as well as a comparison with similar homes in the area
Home Values in the Area
Average Home Value in this Area
Purchase History
| Date | Buyer | Sale Price | Title Company |
|---|---|---|---|
| Ilgandi Edward M | -- | None Listed On Document | |
| Ilgandi Edward M | -- | None Listed On Document | |
| Sheridan Catherine | $145,000 | -- | |
| Macneill Harriet | $75,100 | -- |
Source: Public Records
Mortgage History
| Date | Status | Borrower | Loan Amount |
|---|---|---|---|
| Previous Owner | Sheridan Catherine | $145,000 |
Source: Public Records
Tax History
| Year | Tax Paid | Tax Assessment Tax Assessment Total Assessment is a certain percentage of the fair market value that is determined by local assessors to be the total taxable value of land and additions on the property. | Land | Improvement |
|---|---|---|---|---|
| 2025 | $3,005 | $109,600 | $40,000 | $69,600 |
| 2024 | $2,715 | $109,600 | $40,000 | $69,600 |
| 2023 | $2,675 | $109,600 | $40,000 | $69,600 |
| 2022 | $2,675 | $109,600 | $40,000 | $69,600 |
| 2021 | $2,619 | $109,600 | $40,000 | $69,600 |
| 2020 | $2,585 | $109,600 | $40,000 | $69,600 |
| 2019 | $2,539 | $109,600 | $40,000 | $69,600 |
| 2018 | $2,481 | $109,600 | $40,000 | $69,600 |
| 2017 | $2,414 | $109,600 | $40,000 | $69,600 |
| 2016 | $2,401 | $109,600 | $40,000 | $69,600 |
| 2015 | $2,339 | $109,600 | $40,000 | $69,600 |
| 2014 | $2,319 | $109,600 | $40,000 | $69,600 |
Source: Public Records
Map
Nearby Homes
Your Personal Tour Guide
Ask me questions while you tour the home.