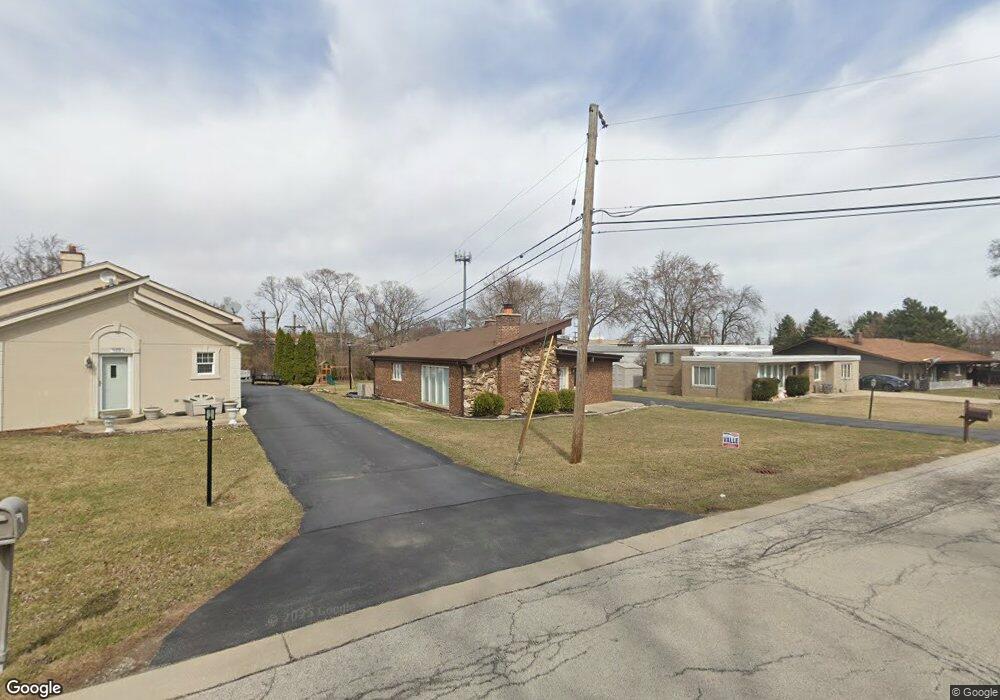
470 E 13th Place Lombard, IL 60148
South Lombard NeighborhoodEstimated Value: $357,000 - $390,000
Studio
--
Bath
1,141
Sq Ft
$328/Sq Ft
Est. Value
About This Home
This home is located at 470 E 13th Place, Lombard, IL 60148 and is currently estimated at $373,795, approximately $327 per square foot. 470 E 13th Place is a home located in DuPage County with nearby schools including Manor Hill Elementary School, Glenn Westlake Middle School, and Glenbard East High School.
Ownership History
Date
Name
Owned For
Owner Type
Purchase Details
Closed on
Mar 10, 2025
Sold by
Sarno Deena M and Lucchetto Mario
Bought by
Lucchetto Deena M and Lucchetto Mario
Current Estimated Value
Home Financials for this Owner
Home Financials are based on the most recent Mortgage that was taken out on this home.
Original Mortgage
$384,000
Outstanding Balance
$380,506
Interest Rate
7.99%
Mortgage Type
New Conventional
Estimated Equity
-$6,711
Purchase Details
Closed on
Oct 25, 2023
Sold by
Borsellino Joseph and Borsellino Theresa
Bought by
Sarno Deena M and Lucchetto Mario
Home Financials for this Owner
Home Financials are based on the most recent Mortgage that was taken out on this home.
Original Mortgage
$318,250
Interest Rate
7.63%
Mortgage Type
New Conventional
Purchase Details
Closed on
Sep 28, 1998
Sold by
Miglio Salvatore J and Miglio Rose Marie
Bought by
Borsellino Joseph and Borsellino Theresa
Purchase Details
Closed on
May 15, 1995
Sold by
Harris Bank Winnetka
Bought by
Miglio Salvatore J and Miglio Rose Marie
Create a Home Valuation Report for This Property
The Home Valuation Report is an in-depth analysis detailing your home's value as well as a comparison with similar homes in the area
Home Values in the Area
Average Home Value in this Area
Purchase History
| Date | Buyer | Sale Price | Title Company |
|---|---|---|---|
| Lucchetto Deena M | -- | National Title Solutions | |
| Sarno Deena M | $350,000 | Chicago Title | |
| Borsellino Joseph | -- | -- | |
| Miglio Salvatore J | -- | -- |
Source: Public Records
Mortgage History
| Date | Status | Borrower | Loan Amount |
|---|---|---|---|
| Open | Lucchetto Deena M | $384,000 | |
| Previous Owner | Sarno Deena M | $318,250 |
Source: Public Records
Tax History
| Year | Tax Paid | Tax Assessment Tax Assessment Total Assessment is a certain percentage of the fair market value that is determined by local assessors to be the total taxable value of land and additions on the property. | Land | Improvement |
|---|---|---|---|---|
| 2024 | $6,110 | $91,324 | $55,508 | $35,816 |
| 2023 | $5,767 | $84,450 | $51,330 | $33,120 |
| 2022 | $5,570 | $81,170 | $49,340 | $31,830 |
| 2021 | $5,399 | $79,150 | $48,110 | $31,040 |
| 2020 | $5,280 | $77,420 | $47,060 | $30,360 |
| 2019 | $5,008 | $73,600 | $44,740 | $28,860 |
| 2018 | $4,581 | $65,110 | $39,580 | $25,530 |
| 2017 | $4,455 | $62,050 | $37,720 | $24,330 |
| 2016 | $4,352 | $58,450 | $35,530 | $22,920 |
| 2015 | $4,207 | $54,450 | $33,100 | $21,350 |
| 2014 | $4,989 | $61,700 | $40,730 | $20,970 |
| 2013 | $4,896 | $62,570 | $41,300 | $21,270 |
Source: Public Records
Map
Nearby Homes
- 1450 S Stewart Ave
- 1401 S Fairfield Ave
- 1424 S Fairfield Ave
- 31 E 14th Place
- 1621 S Highland Ave
- 1320A Lore Ln Unit 101
- 1320A Lore Ln Unit 122
- 1703 S Highland Ave
- 300 Norton St
- 1320B Lore Ln Unit 110
- 126 June Ln
- 232 Eastgate Rd
- 1709 S Highland Ave
- 212 Collen Dr Unit 209
- 1901 S Main St
- 939 S Grace St
- 1331 S Finley Rd Unit 413
- 1331 S Finley Rd Unit 104
- 2030 Saint Regis Dr
- 2000 Saint Regis Dr Unit 3G
- 500 E 13th Place
- 460 E 13th Place
- 510 E 13th Place
- 450 E 13th Place
- 1301 S Stewart Ave
- 520 E 13th Place
- 1300 S Lombard Ave
- 440 E 13th Place
- 1311 S Stewart Ave
- 530 E 13th Place
- 1321 S Stewart Ave
- 1235 S Highland Ave
- 1235 S Highland Ave
- 1320 S Lombard Ave
- 540 E 13th Place
- 430 E 13th Place
- 1331 S Stewart Ave
- 1300 S Stewart Ave
- 1301 S Lombard Ave
- 1330 S Lombard Ave
Your Personal Tour Guide
Ask me questions while you tour the home.