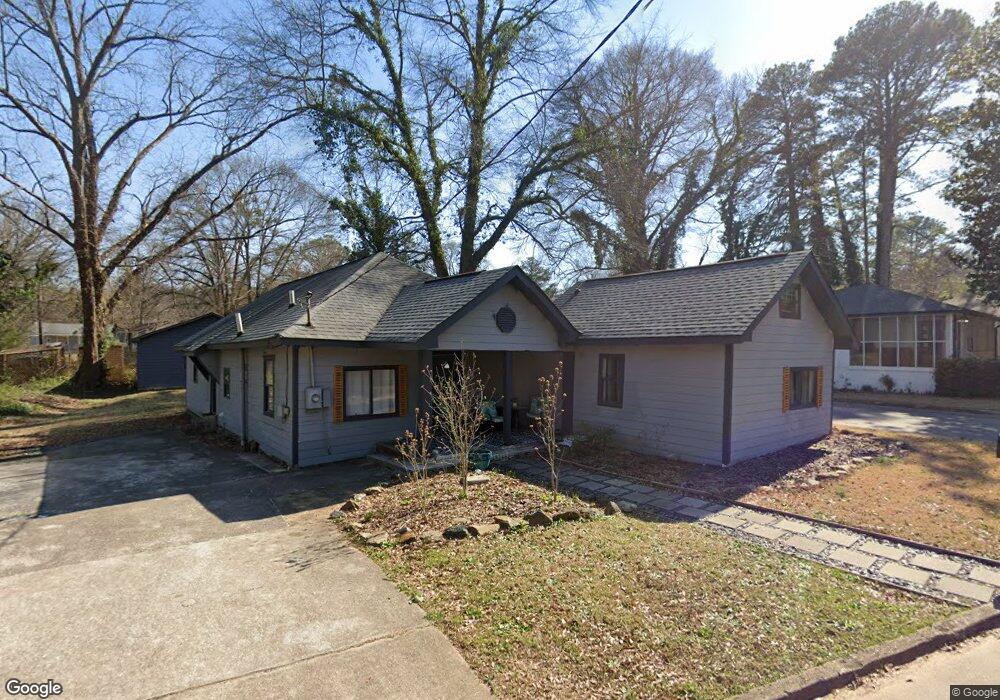
470 Oak Dr Atlanta, GA 30354
Estimated Value: $313,000 - $432,000
4
Beds
2
Baths
1,562
Sq Ft
$231/Sq Ft
Est. Value
About This Home
This home is located at 470 Oak Dr, Atlanta, GA 30354 and is currently estimated at $360,686, approximately $230 per square foot. 470 Oak Dr is a home located in Fulton County with nearby schools including Hapeville Elementary School, Paul D. West Middle School, and Tri-Cities High School.
Ownership History
Date
Name
Owned For
Owner Type
Purchase Details
Closed on
Feb 5, 2021
Sold by
Martinez Nanisha
Bought by
Martinez Nanisha and Lewis Daniel
Current Estimated Value
Home Financials for this Owner
Home Financials are based on the most recent Mortgage that was taken out on this home.
Original Mortgage
$152,000
Outstanding Balance
$134,575
Interest Rate
2.65%
Mortgage Type
New Conventional
Estimated Equity
$226,111
Purchase Details
Closed on
Nov 20, 2020
Sold by
Tran Nghia
Bought by
Anthony Tran Llc
Purchase Details
Closed on
Feb 26, 2019
Sold by
Tran Nghia
Bought by
Tran Nghia and Nguyen Dung
Purchase Details
Closed on
Jul 10, 2018
Bought by
Gray Elizabeth H
Home Financials for this Owner
Home Financials are based on the most recent Mortgage that was taken out on this home.
Original Mortgage
$230,745
Interest Rate
4.52%
Purchase Details
Closed on
Apr 14, 2008
Sold by
Homebanc Mortgage Corp
Bought by
Favour Capital Llc
Purchase Details
Closed on
Jan 22, 2008
Sold by
Deutsche Bk Ixis 2006 & He2
Bought by
Tran Nghia
Home Financials for this Owner
Home Financials are based on the most recent Mortgage that was taken out on this home.
Original Mortgage
$52,500
Interest Rate
6.06%
Mortgage Type
New Conventional
Purchase Details
Closed on
Sep 4, 2007
Sold by
Lance King
Bought by
Deutsche Bk Trust C Ixis 2006 &
Purchase Details
Closed on
Feb 28, 2006
Sold by
Finch Delano
Bought by
Lance King
Home Financials for this Owner
Home Financials are based on the most recent Mortgage that was taken out on this home.
Original Mortgage
$112,800
Interest Rate
8.66%
Mortgage Type
New Conventional
Purchase Details
Closed on
Oct 28, 2005
Sold by
Bankc Of New York Cwabs 200
Bought by
Finch Delano
Home Financials for this Owner
Home Financials are based on the most recent Mortgage that was taken out on this home.
Original Mortgage
$89,000
Interest Rate
5.76%
Mortgage Type
New Conventional
Purchase Details
Closed on
Apr 19, 2004
Sold by
Soley Michaek I
Bought by
Soley Samuel M
Home Financials for this Owner
Home Financials are based on the most recent Mortgage that was taken out on this home.
Original Mortgage
$121,500
Interest Rate
7.5%
Mortgage Type
New Conventional
Purchase Details
Closed on
Mar 28, 2003
Sold by
720 Properties Llc
Bought by
Ndure Michael
Home Financials for this Owner
Home Financials are based on the most recent Mortgage that was taken out on this home.
Original Mortgage
$86,985
Interest Rate
5.74%
Mortgage Type
New Conventional
Purchase Details
Closed on
Aug 23, 2002
Sold by
Tang Minh
Bought by
Sam Phaly
Create a Home Valuation Report for This Property
The Home Valuation Report is an in-depth analysis detailing your home's value as well as a comparison with similar homes in the area
Home Values in the Area
Average Home Value in this Area
Purchase History
We collect this data history from publicly available records. To have your information removed, we recommend requesting removal directly through your county’s website.
| Date | Buyer | Sale Price | Title Company |
|---|---|---|---|
| Martinez Nanisha | -- | -- | |
| Martinez Nanisha | $160,000 | -- | |
| Anthony Tran Llc | -- | -- | |
| Tran Nghia | -- | -- | |
| Gray Elizabeth H | $230,800 | -- | |
| Favour Capital Llc | -- | -- | |
| Tran Nghia | $70,000 | -- | |
| Deutsche Bk Trust C Ixis 2006 & | $97,665 | -- | |
| Lance King | $141,000 | -- | |
| Finch Delano | $63,000 | -- | |
| Soley Samuel M | $135,000 | -- | |
| Ndure Michael | $65,000 | -- | |
| Sam Phaly | -- | -- |
Source: Public Records
Mortgage History
We collect this data history from publicly available records. To have your information removed, we recommend requesting removal directly through your county’s website.
| Date | Status | Borrower | Loan Amount |
|---|---|---|---|
| Open | Martinez Nanisha | $152,000 | |
| Closed | Martinez Nanisha | $152,000 | |
| Previous Owner | Gray Elizabeth H | $230,745 | |
| Previous Owner | Gray Elizabeth H | -- | |
| Previous Owner | Tran Nghia | $52,500 | |
| Previous Owner | Lance King | $112,800 | |
| Previous Owner | Finch Delano | $89,000 | |
| Previous Owner | Soley Samuel M | $121,500 | |
| Previous Owner | Ndure Michael | $86,985 |
Source: Public Records
Tax History
| Year | Tax Paid | Tax Assessment Tax Assessment Total Assessment is a certain percentage of the fair market value that is determined by local assessors to be the total taxable value of land and additions on the property. | Land | Improvement |
|---|---|---|---|---|
| 2025 | $2,169 | $138,520 | $27,840 | $110,680 |
| 2023 | $4,114 | $145,760 | $34,040 | $111,720 |
| 2022 | $1,684 | $64,000 | $22,720 | $41,280 |
| 2021 | $3,446 | $80,400 | $28,640 | $51,760 |
| 2020 | $3,102 | $70,840 | $24,280 | $46,560 |
| 2019 | $1,130 | $70,160 | $9,600 | $60,560 |
| 2018 | $1,935 | $68,560 | $9,400 | $59,160 |
| 2017 | $764 | $26,200 | $5,240 | $20,960 |
| 2016 | $765 | $26,200 | $5,240 | $20,960 |
| 2015 | $1,203 | $26,200 | $5,240 | $20,960 |
| 2014 | $803 | $26,200 | $5,240 | $20,960 |
Source: Public Records
Map
Nearby Homes
Your Personal Tour Guide
Ask me questions while you tour the home.