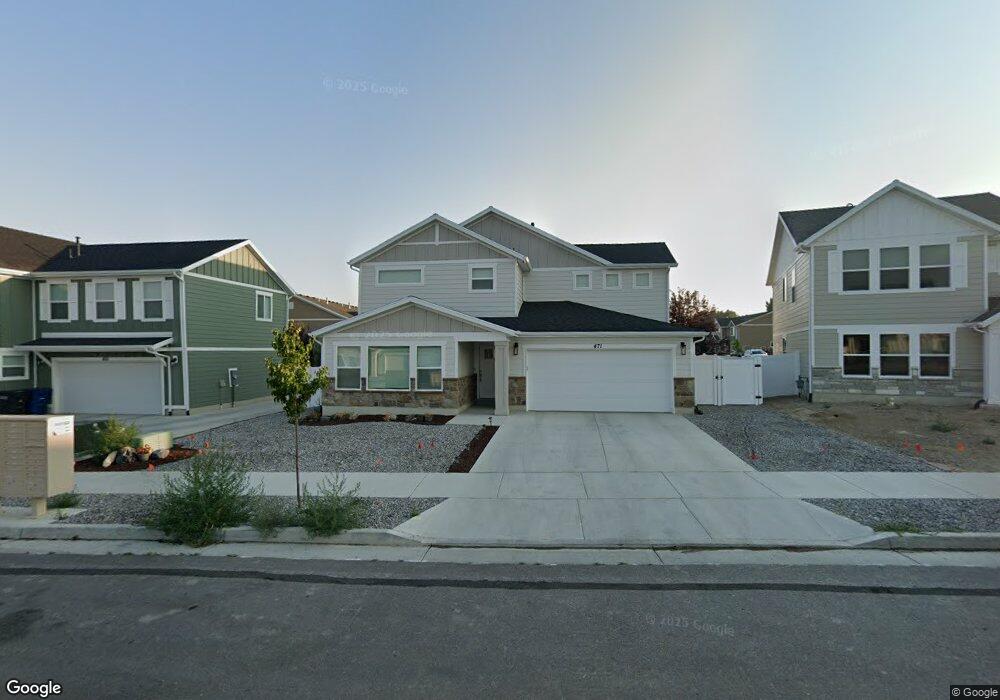
471 E 2130 N Unit 8 North Logan, UT 84341
Estimated Value: $485,000 - $529,000
4
Beds
3
Baths
1,918
Sq Ft
$261/Sq Ft
Est. Value
About This Home
This home is located at 471 E 2130 N Unit 8, North Logan, UT 84341 and is currently estimated at $500,976, approximately $261 per square foot. 471 E 2130 N Unit 8 is a home located in Cache County with nearby schools including Greenville School, Cedar Ridge School, and North Cache Middle School.
Ownership History
Date
Name
Owned For
Owner Type
Purchase Details
Closed on
Jun 5, 2024
Sold by
Bokinsky Timothy Luke and Bokinsky Megan Ella
Bought by
Slade Cameron and Peck Jacquelynne
Current Estimated Value
Purchase Details
Closed on
Nov 16, 2023
Sold by
Sierra Home Builders Llc
Bought by
Bokinsky Timothy Luke and Bokinsky Megan Ella
Home Financials for this Owner
Home Financials are based on the most recent Mortgage that was taken out on this home.
Original Mortgage
$419,385
Interest Rate
7.49%
Mortgage Type
New Conventional
Purchase Details
Closed on
May 2, 2023
Sold by
Heritage Land Development Llc
Bought by
Sierra Homes Construction Inc
Home Financials for this Owner
Home Financials are based on the most recent Mortgage that was taken out on this home.
Original Mortgage
$348,000
Interest Rate
6.42%
Mortgage Type
Construction
Create a Home Valuation Report for This Property
The Home Valuation Report is an in-depth analysis detailing your home's value as well as a comparison with similar homes in the area
Home Values in the Area
Average Home Value in this Area
Purchase History
| Date | Buyer | Sale Price | Title Company |
|---|---|---|---|
| Slade Cameron | -- | Northern Title | |
| Bokinsky Timothy Luke | -- | Northern Title Company | |
| Sierra Home Builders Llc | -- | Northern Title Company | |
| Sierra Homes Construction Inc | -- | Us Title |
Source: Public Records
Mortgage History
| Date | Status | Borrower | Loan Amount |
|---|---|---|---|
| Previous Owner | Bokinsky Timothy Luke | $419,385 | |
| Previous Owner | Sierra Homes Construction Inc | $348,000 |
Source: Public Records
Tax History
| Year | Tax Paid | Tax Assessment Tax Assessment Total Assessment is a certain percentage of the fair market value that is determined by local assessors to be the total taxable value of land and additions on the property. | Land | Improvement |
|---|---|---|---|---|
| 2025 | $1,892 | $264,835 | $0 | $0 |
| 2024 | $2,238 | $291,560 | $0 | $0 |
| 2023 | $738 | $90,000 | $90,000 | $0 |
| 2022 | $773 | $90,000 | $90,000 | $0 |
| 2021 | $906 | $90,000 | $90,000 | $0 |
Source: Public Records
Map
Nearby Homes
- 2048 N 350 E
- 385 E 2280 N Unit D
- 327 E 2230 N Unit A
- 673 E 2000 N
- 741 E 2200 N
- 2168 N 750 E
- 623 E 2475 N Unit 5
- 2469 N 620 E
- 2469 N 620 E Unit 3
- 2477 N 620 E Unit 4
- 630 E 2475 N
- 2356 N 150 E
- 2396 N 200 E
- 2308 N 800 E
- 732 E 2475 N Unit 52
- 732 E 2475 N
- 729 E 2475 N
- 161 E 2440 N
- 2575 N 270 E
- 2640 N Aspen Park Ln
Your Personal Tour Guide
Ask me questions while you tour the home.