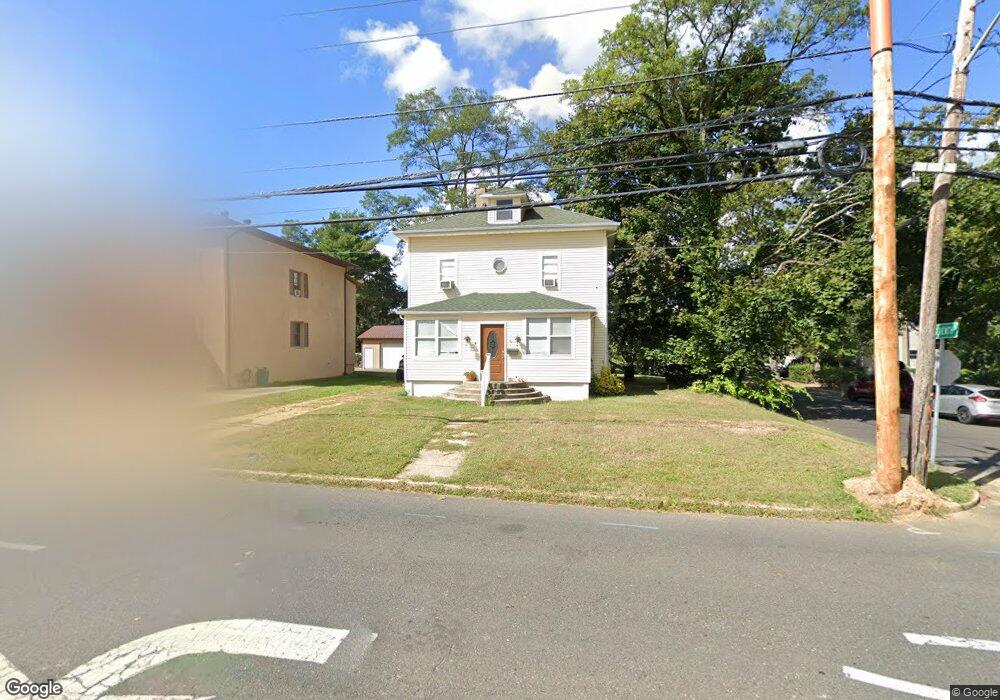
473 Atlantic Ave Matawan, NJ 07747
Estimated Value: $442,122 - $513,000
3
Beds
1
Bath
1,302
Sq Ft
$376/Sq Ft
Est. Value
About This Home
This home is located at 473 Atlantic Ave, Matawan, NJ 07747 and is currently estimated at $490,031, approximately $376 per square foot. 473 Atlantic Ave is a home located in Monmouth County with nearby schools including Matawan Reg High School, St Benedict School, and St. Joseph Elementary School.
Ownership History
Date
Name
Owned For
Owner Type
Purchase Details
Closed on
Feb 12, 2003
Sold by
Craparo James
Bought by
Quinlan David and Quinlan Kathleen
Current Estimated Value
Home Financials for this Owner
Home Financials are based on the most recent Mortgage that was taken out on this home.
Original Mortgage
$137,025
Outstanding Balance
$58,813
Interest Rate
5.98%
Estimated Equity
$431,218
Purchase Details
Closed on
Mar 4, 1999
Sold by
Crockett Geraldine
Bought by
Innovative Housing Development
Purchase Details
Closed on
May 22, 1997
Sold by
Hfc Enterprises
Bought by
Craparo James and Craparo Carole
Create a Home Valuation Report for This Property
The Home Valuation Report is an in-depth analysis detailing your home's value as well as a comparison with similar homes in the area
Home Values in the Area
Average Home Value in this Area
Purchase History
We collect this data history from publicly available records. To have your information removed, we recommend requesting removal directly through your county’s website.
| Date | Buyer | Sale Price | Title Company |
|---|---|---|---|
| Quinlan David | $180,000 | -- | |
| Innovative Housing Development | $21,000 | -- | |
| Craparo James | $110,000 | -- |
Source: Public Records
Mortgage History
We collect this data history from publicly available records. To have your information removed, we recommend requesting removal directly through your county’s website.
| Date | Status | Borrower | Loan Amount |
|---|---|---|---|
| Open | Quinlan David | $137,025 |
Source: Public Records
Tax History
| Year | Tax Paid | Tax Assessment Tax Assessment Total Assessment is a certain percentage of the fair market value that is determined by local assessors to be the total taxable value of land and additions on the property. | Land | Improvement |
|---|---|---|---|---|
| 2025 | $6,192 | $325,100 | $183,500 | $141,600 |
| 2024 | $6,028 | $306,400 | $167,400 | $139,000 |
| 2023 | $6,028 | $281,800 | $146,100 | $135,700 |
| 2022 | $5,882 | $247,200 | $118,000 | $129,200 |
| 2021 | $5,882 | $217,600 | $102,700 | $114,900 |
| 2020 | $5,835 | $215,000 | $102,700 | $112,300 |
| 2019 | $6,192 | $221,600 | $109,900 | $111,700 |
| 2018 | $6,307 | $226,300 | $119,800 | $106,500 |
| 2017 | $5,908 | $215,000 | $111,700 | $103,300 |
| 2016 | $5,711 | $216,900 | $116,200 | $100,700 |
| 2015 | $5,974 | $217,800 | $119,700 | $98,100 |
| 2014 | $5,622 | $209,000 | $111,600 | $97,400 |
Source: Public Records
Map
Nearby Homes
Your Personal Tour Guide
Ask me questions while you tour the home.