Estimated Value: $384,191 - $475,000
Studio
2
Baths
1,792
Sq Ft
$249/Sq Ft
Est. Value
About This Home
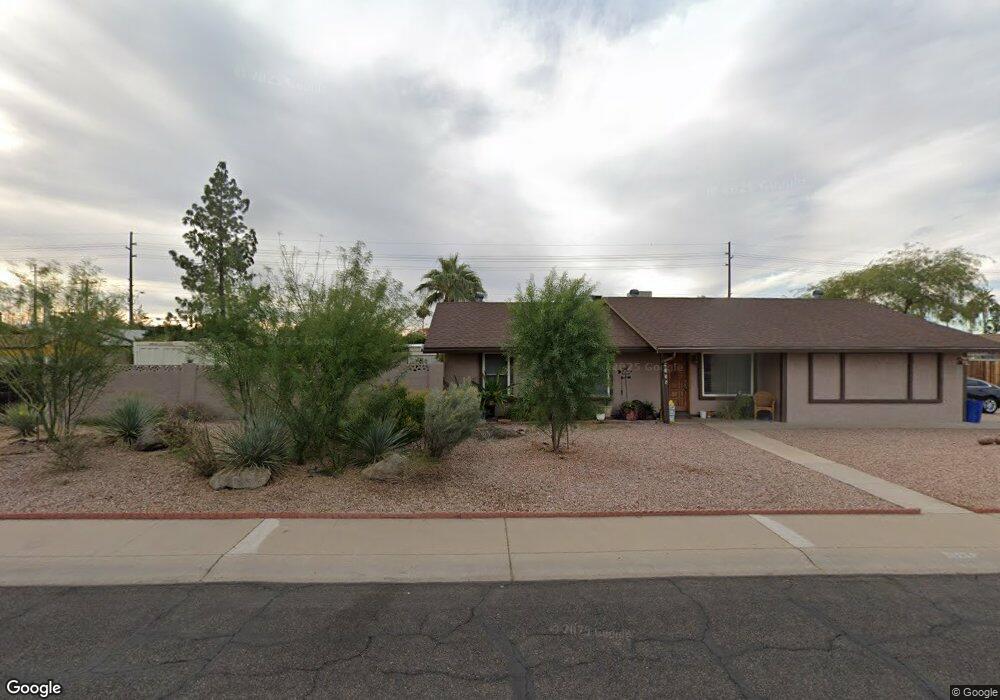
This home is located at 4733 E Greenway St, Mesa, AZ 85205 and is currently estimated at $446,298, approximately $249 per square foot. 4733 E Greenway St is a home located in Maricopa County with nearby schools including Bush Elementary School, Franklin at Brimhall Elementary School, and Franklin West Elementary School.
Ownership History
Date
Name
Owned For
Owner Type
Purchase Details
Closed on
Dec 20, 2018
Sold by
Skywalker Investments Llc
Bought by
Quinones David W and Gilchrist Alexandra J
Current Estimated Value
Home Financials for this Owner
Home Financials are based on the most recent Mortgage that was taken out on this home.
Original Mortgage
$241,300
Outstanding Balance
$212,888
Interest Rate
4.87%
Mortgage Type
FHA
Estimated Equity
$233,410
Purchase Details
Closed on
Jun 21, 2018
Sold by
Quevedo Esther
Bought by
Skywalker Investments Llc
Home Financials for this Owner
Home Financials are based on the most recent Mortgage that was taken out on this home.
Original Mortgage
$157,500
Interest Rate
4.5%
Mortgage Type
New Conventional
Create a Home Valuation Report for This Property
The Home Valuation Report is an in-depth analysis detailing your home's value as well as a comparison with similar homes in the area
Purchase History
| Date | Buyer | Sale Price | Title Company |
|---|---|---|---|
| Quinones David W | $279,000 | Great American Title Agency | |
| Skywalker Investments Llc | $165,000 | Encore Title Agency Llc |
Source: Public Records
Mortgage History
| Date | Status | Borrower | Loan Amount |
|---|---|---|---|
| Open | Quinones David W | $241,300 | |
| Previous Owner | Skywalker Investments Llc | $157,500 |
Source: Public Records
Tax History
| Year | Tax Paid | Tax Assessment Tax Assessment Total Assessment is a certain percentage of the fair market value that is determined by local assessors to be the total taxable value of land and additions on the property. | Land | Improvement |
|---|---|---|---|---|
| 2025 | $1,286 | $15,089 | -- | -- |
| 2024 | $1,329 | $14,370 | -- | -- |
| 2023 | $1,329 | $30,620 | $6,120 | $24,500 |
| 2022 | $1,302 | $22,870 | $4,570 | $18,300 |
| 2021 | $1,334 | $20,470 | $4,090 | $16,380 |
| 2020 | $1,315 | $18,550 | $3,710 | $14,840 |
| 2019 | $1,226 | $15,280 | $3,050 | $12,230 |
| 2018 | $1,380 | $14,250 | $2,850 | $11,400 |
| 2017 | $1,146 | $13,930 | $2,780 | $11,150 |
| 2016 | $1,112 | $12,750 | $2,550 | $10,200 |
| 2015 | $1,055 | $12,170 | $2,430 | $9,740 |
Source: Public Records
Map
Nearby Homes
- 4729 E Greenway St
- 4716 E Greenway St Unit 4
- 4725 E Brown Rd Unit 70
- 4913 E Fox St
- 5011 E Greenway St
- 5022 E Glencove St
- 4747 E Hannibal St
- 1358 N St Paul --
- 4746 E Hannibal St
- 4528 E Hobart St
- 4562 E Elmwood St
- 4349 E Fairbrook Cir
- 5230 E Brown Rd Unit 269
- 5230 E Brown Rd Unit 110
- 4326 E Fairbrook Cir
- 4449 E Elmwood St
- 4335 E Fox Cir
- 1525 N Balboa
- 1543 N Balboa
- 4556 E Downing St
- 4735 E Greenway St
- 1212 N 48th St
- 1220 N 48th St
- 4731 E Greenway St
- 4746 E Greenway St
- 4736 E Greenway St
- 4756 E Greenway St
- 4715 E Greenway St
- 4724 E Greenway St
- 4741 E Glencove St
- 4733 E Glencove St
- 4751 E Glencove St
- 4703 E Greenway St
- 4719 E Glencove St
- 4725 E Brown #64 Dr Unit 64
- 4803 E Glencove Cir
- 4711 E Glencove St
- 4706 E Greenway St
- 4661 E Greenway St
- 4542 E Gary St
Your Personal Tour Guide
Ask me questions while you tour the home.