
Landlord's Agent in 2024
Anne Marie Small
Keller Williams Village Square Realty
(201) 280-7729
3 in this area
13 Total Sales
Estimated Value: $289,412 - $302,000
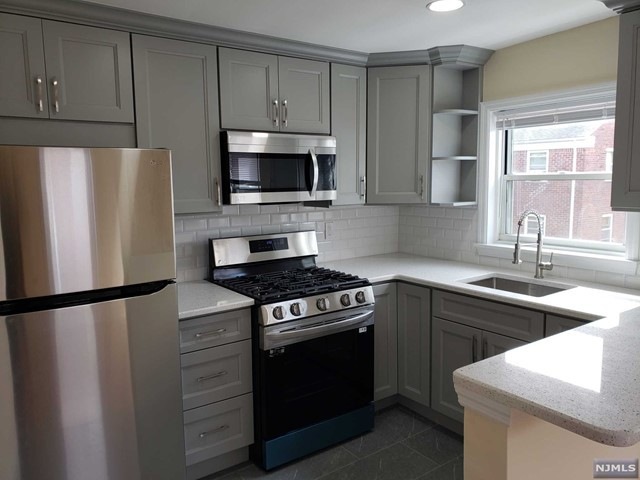
Large corner unit! Sunny and spacious on 2nd floor. Beautiful open kitchen with stainlees steel appliances. Recently updated bathroom, wood floors, lots of windows provide plenty of natural light! This is the largest unit in Suburban Terrace (approx 856 sq ft). Primary bedroom will easily fit a king-size bed. Nice location on Maywood border close to NYC transportation & shopping. Parking lot & laundry in complex. Rent INCLUDES heat, hot water, sewer, and parking. Tenant pays utilities. Application, credit check & interview required. Prefer no pets, please.
Last Agent to Rent the Property
Keller Williams Village Square Realty Listed on: 11/07/2024
We collect this data history from publicly available records. To have your information removed, we recommend requesting removal directly through your county’s website.
| Date | Buyer | Sale Price | Title Company |
|---|---|---|---|
| Andreou 475-08 Colonial Llc | $250,000 | Carnegie Title | |
| Andreou 475-08 Colonial Llc | $250,000 | Carnegie Title | |
| Brar Kanwarjit Singh | $225,000 | Muller Michael J | |
| Paprazzo Matthew | $262,000 | -- |
We collect this data history from publicly available records. To have your information removed, we recommend requesting removal directly through your county’s website.
| Date | Status | Borrower | Loan Amount |
|---|---|---|---|
| Previous Owner | Brar Kanwarjit Singh | $168,750 |
| Date | Event | Price | List to Sale | Price per Sq Ft | Prior Sale |
|---|---|---|---|---|---|
| 12/07/2024 12/07/24 | Rented | $2,500 | 0.0% | -- | |
| 11/07/2024 11/07/24 | For Rent | $2,500 | 0.0% | -- | |
| 11/15/2023 11/15/23 | Rented | $2,500 | 0.0% | -- | |
| 10/28/2023 10/28/23 | Price Changed | $2,500 | -5.7% | -- | |
| 10/10/2023 10/10/23 | For Rent | $2,650 | 0.0% | -- | |
| 09/18/2023 09/18/23 | Sold | $250,000 | 0.0% | -- | View Prior Sale |
| 08/01/2023 08/01/23 | Pending | -- | -- | -- | |
| 07/13/2023 07/13/23 | For Sale | $250,000 | +11.1% | -- | |
| 01/28/2022 01/28/22 | Sold | $225,000 | 0.0% | -- | View Prior Sale |
| 01/03/2022 01/03/22 | Off Market | $225,000 | -- | -- | |
| 10/27/2021 10/27/21 | Pending | -- | -- | -- | |
| 10/01/2021 10/01/21 | For Sale | $240,000 | -- | -- |
| Year | Tax Paid | Tax Assessment Tax Assessment Total Assessment is a certain percentage of the fair market value that is determined by local assessors to be the total taxable value of land and additions on the property. | Land | Improvement |
|---|---|---|---|---|
| 2025 | $6,424 | $210,200 | $105,000 | $105,200 |
| 2024 | $6,052 | $210,200 | $105,000 | $105,200 |
| 2023 | $5,601 | $210,200 | $105,000 | $105,200 |
| 2022 | $5,601 | $199,900 | $100,000 | $99,900 |
| 2021 | $5,618 | $167,300 | $88,000 | $79,300 |
| 2020 | $5,536 | $167,300 | $88,000 | $79,300 |
| 2019 | $5,411 | $161,200 | $86,000 | $75,200 |
| 2018 | $5,181 | $151,800 | $86,500 | $65,300 |
| 2017 | $5,109 | $149,600 | $85,000 | $64,600 |
| 2016 | $5,033 | $149,000 | $85,000 | $64,000 |
| 2015 | $5,474 | $156,400 | $62,200 | $94,200 |
| 2014 | $5,196 | $156,400 | $62,200 | $94,200 |
Landlord's Agent in 2024
Anne Marie Small
Keller Williams Village Square Realty
(201) 280-7729
3 in this area
13 Total Sales
A
Tenant's Agent in 2024
Alyna Torres
Luxe Listings
(201) 660-0261
Seller's Agent in 2023
Salvatore Cozzupoli
Keller Williams Village Square Realty
(201) 841-2064
2 in this area
44 Total Sales
S
Buyer's Agent in 2023
Stephanie Nunez
Lifestyle International Realty
(929) 333-0134
4 Total Sales
Seller's Agent in 2022
Rebecca LaPira
RE/MAX
(201) 779-1630
1 in this area
125 Total Sales
H
Seller Co-Listing Agent in 2022
Hee Yeon Park
RE/MAX
(201) 981-0379
1 in this area
26 Total Sales
Source: New Jersey MLS
MLS Number: 24035833
APN: 23-00354-0000-00037-0000-C0008
Disclaimer: Certain information contained herein is derived from information provided by parties other than Homes.com. All information provided is deemed reliable, but is not guaranteed to be accurate and should be independently verified.
![]() The data relating to the real estate for sale on this web site comes in part from the Internet Data Exchange Program of the NJMLS. Real estate listings held by brokerage firms other than Ten-X are marked with the Internet Data Exchange logo and information about them includes the name of the listing brokers. Some properties listed with the participating brokers do not appear on this website at the request of the seller. Listings of brokers that do not participate in Internet Data Exchange do not appear on this website.
The data relating to the real estate for sale on this web site comes in part from the Internet Data Exchange Program of the NJMLS. Real estate listings held by brokerage firms other than Ten-X are marked with the Internet Data Exchange logo and information about them includes the name of the listing brokers. Some properties listed with the participating brokers do not appear on this website at the request of the seller. Listings of brokers that do not participate in Internet Data Exchange do not appear on this website.
All information deemed reliable but not guaranteed. Source: New Jersey Multiple Listing, Inc.
© 2026 New Jersey Multiple Listing Service Inc. All rights reserved.
Ask me questions while you tour the home.