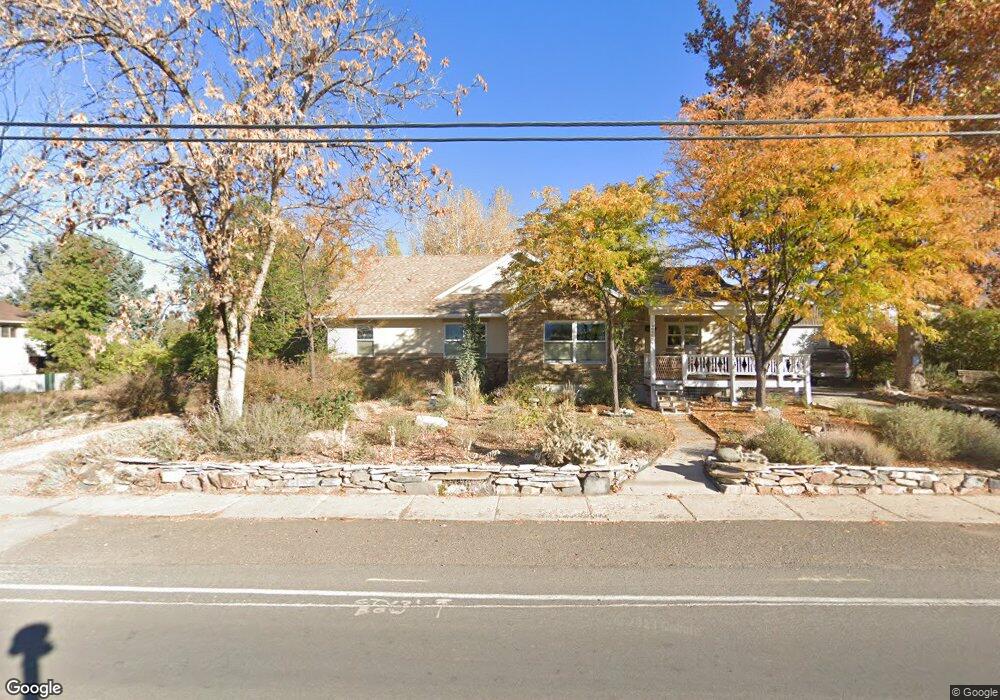
475 E Maple St Mapleton, UT 84664
Estimated Value: $588,000 - $820,000
3
Beds
2
Baths
1,904
Sq Ft
$369/Sq Ft
Est. Value
About This Home
This home is located at 475 E Maple St, Mapleton, UT 84664 and is currently estimated at $702,014, approximately $368 per square foot. 475 E Maple St is a home located in Utah County with nearby schools including Mapleton School, Mapleton Junior High School, and Maple Mountain High School.
Ownership History
Date
Name
Owned For
Owner Type
Purchase Details
Closed on
Apr 21, 1998
Sold by
Dyle Walter S and Larsen Sue R
Bought by
Dyle Sue R and Dyle Walter S
Current Estimated Value
Home Financials for this Owner
Home Financials are based on the most recent Mortgage that was taken out on this home.
Original Mortgage
$111,200
Interest Rate
7.15%
Purchase Details
Closed on
Nov 6, 1996
Sold by
Hone Blaine Lee and Hone Alicia S
Bought by
Dyle Walter S and Larsen Sue R
Create a Home Valuation Report for This Property
The Home Valuation Report is an in-depth analysis detailing your home's value as well as a comparison with similar homes in the area
Home Values in the Area
Average Home Value in this Area
Purchase History
| Date | Buyer | Sale Price | Title Company |
|---|---|---|---|
| Dyle Sue R | -- | -- | |
| Dyle Walter S | -- | -- |
Source: Public Records
Mortgage History
| Date | Status | Borrower | Loan Amount |
|---|---|---|---|
| Closed | Dyle Sue R | $111,200 |
Source: Public Records
Tax History
| Year | Tax Paid | Tax Assessment Tax Assessment Total Assessment is a certain percentage of the fair market value that is determined by local assessors to be the total taxable value of land and additions on the property. | Land | Improvement |
|---|---|---|---|---|
| 2025 | $2,601 | $339,570 | -- | -- |
| 2024 | $2,601 | $305,360 | $0 | $0 |
| 2023 | $2,646 | $308,825 | $0 | $0 |
| 2022 | $3,296 | $349,690 | $0 | $0 |
| 2021 | $2,588 | $437,500 | $223,700 | $213,800 |
| 2020 | $2,503 | $411,800 | $198,000 | $213,800 |
| 2019 | $2,622 | $387,400 | $190,000 | $197,400 |
| 2018 | $1,777 | $249,900 | $160,000 | $89,900 |
| 2017 | $1,681 | $125,510 | $0 | $0 |
| 2016 | $1,542 | $114,400 | $0 | $0 |
| 2015 | $1,429 | $105,435 | $0 | $0 |
| 2014 | $1,418 | $102,685 | $0 | $0 |
Source: Public Records
Map
Nearby Homes
- 415 E Maple St
- 141 N 600 E
- 745 E Maple St
- 162 N 800 E
- 1377 E Maple St
- 310 N 800 E
- 84 E 530 N
- 265 E 600 N
- 775 N 800 E
- 594 E 1000 N
- 435 E 1000 N
- 4021 S Ironwood Ln Unit 428
- 4886 S Englemann Ln Unit 525
- 2254 715 S Unit 60
- 4013 S Ironwood Ln Unit 432
- 4014 S Ironwood Ln
- 4001 S Ironwood Ln Unit 438
- 2254 715 S
- 4012 S Ironwood Ln Unit 424
- 2042 715 S Unit 57
- 509 E Maple St
- 506 E Maple St
- 575 E Maple St
- 917 Crescent Way
- 931 Crescent Way
- 1989 Crescent Dr
- 1995 Crescent Dr
- 2001 Crescent Dr
- 560 E Maple St
- 375 E Maple St
- 585 E Maple St
- 75 N 600 E
- 590 E Maple St
- 301 E Maple St
- 48 N 300 E
- 615 E Maple St
- 60 N 600 E
- 340 E Maple St Unit CES01A
- 462 E 200 N
- 462 E 200 N Unit 4
Your Personal Tour Guide
Ask me questions while you tour the home.