Estimated Value: $210,000 - $226,000
About This Home
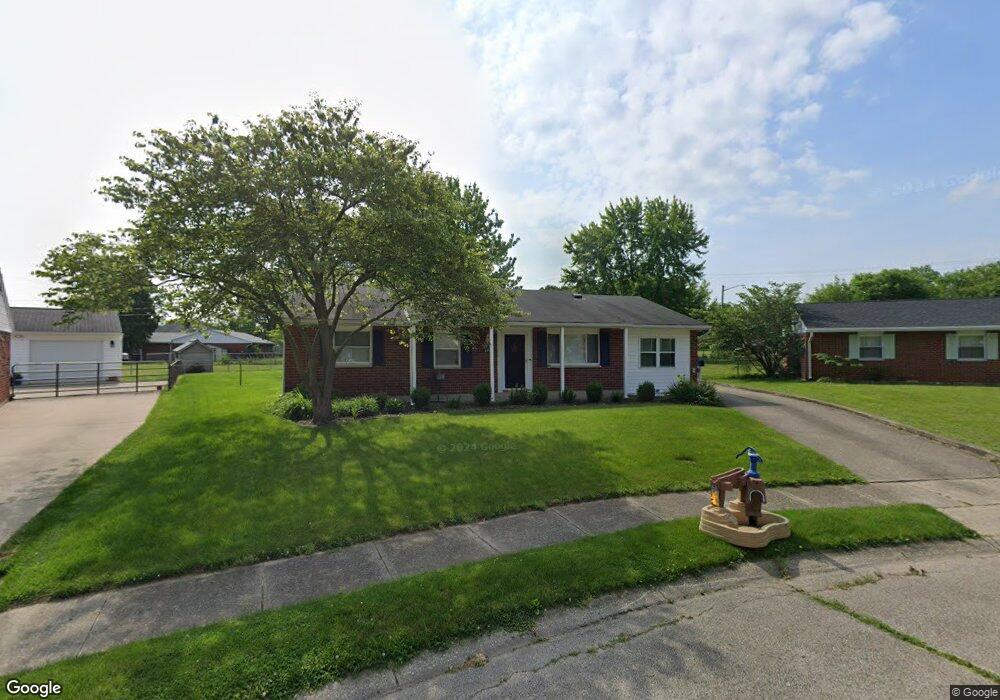
This home is located at 475 Mayfield Square E, Troy, OH 45373 and is currently estimated at $218,588, approximately $165 per square foot. 475 Mayfield Square E is a home located in Miami County with nearby schools including Cookson Elementary School, Troy Junior High School, and Van Cleve Elementary School.
Ownership History
We collect this data history from publicly available records. To have your information removed, we recommend requesting removal directly through your county’s website.
Purchase Details
Home Financials for this Owner
Home Financials are based on the most recent Mortgage that was taken out on this home.Purchase Details
Home Financials for this Owner
Home Financials are based on the most recent Mortgage that was taken out on this home.Purchase Details
Purchase Details
Home Values in the Area
Average Home Value in this Area
Purchase History
We collect this data history from publicly available records. To have your information removed, we recommend requesting removal directly through your county’s website.
| Date | Buyer | Sale Price | Title Company |
|---|---|---|---|
| $126,000 | None Available | ||
| $111,000 | Attorney | ||
| -- | -- | ||
| $43,000 | -- |
Mortgage History
We collect this data history from publicly available records. To have your information removed, we recommend requesting removal directly through your county’s website.
| Date | Status | Borrower | Loan Amount |
|---|---|---|---|
| Open | $123,717 | ||
| Previous Owner | $88,800 |
Tax History
We collect this data history from publicly available records. To have your information removed, we recommend requesting removal directly through your county’s website.
| Year | Tax Paid | Tax Assessment Tax Assessment Total Assessment is a certain percentage of the fair market value that is determined by local assessors to be the total taxable value of land and additions on the property. | Land | Improvement |
|---|---|---|---|---|
| 2025 | $2,231 | $64,830 | $12,150 | $52,680 |
| 2024 | $2,231 | $50,960 | $13,090 | $37,870 |
| 2023 | $1,921 | $50,960 | $13,090 | $37,870 |
| 2022 | $1,600 | $50,960 | $13,090 | $37,870 |
| 2021 | $1,295 | $39,200 | $10,080 | $29,120 |
| 2020 | $1,297 | $39,200 | $10,080 | $29,120 |
| 2019 | $1,309 | $39,200 | $10,080 | $29,120 |
| 2018 | $1,181 | $34,030 | $10,680 | $23,350 |
| 2017 | $1,193 | $34,030 | $10,680 | $23,350 |
| 2016 | $1,175 | $34,030 | $10,680 | $23,350 |
| 2015 | $1,157 | $32,100 | $10,080 | $22,020 |
| 2014 | $1,157 | $32,100 | $10,080 | $22,020 |
| 2013 | $1,164 | $32,100 | $10,080 | $22,020 |
Map
- 0 E State Route 55 Unit K30-005510
- 0 E State Route 55 Unit K30-005520
- 486 Locust Ln
- 617 Locust Ln
- 0 St Rt 718 Unit Lot 1
- 810 Meadow Ln
- 1141 Lee Rd
- 1142 Lee Rd
- 2033 Lefevre Rd
- 1178 Stonyridge Ave
- 940 E Main St
- 1234 Gettysburg Dr
- 814 N Market St
- 708 N Market St
- 119 Floral Ave
- 2120 E State Route 55
- 702 E Franklin St
- 1337 Maplecrest Dr
- 119 Morehead St
- 1655 Saratoga Dr
- 471 Mayfield Square E
- 479 Mayfield Square E
- 476 Mayfield Square E
- 474 Mayfield Ct
- 478 Mayfield Ct
- 469 Mayfield Square W
- 483 Mayfield Ct
- 458 Mayfield Square W
- 480 Mayfield Square E
- 482 Mayfield Ct
- 473 Mayfield Square W
- 487 Mayfield Square E
- 484 Mayfield Square E
- 477 Mayfield Square W
- 473 Mayfield Ct
- 462 Mayfield Square W
- 486 Mayfield Ct
- 1021 E Staunton Rd
- 7 S State Route 202
- 481 Mayfield Square W
Ask me questions while you tour the home.