
Landlord's Agent in 2025
Breanna Castro
Covington & Associates
(858) 248-7494
10 Total Sales
Estimated Value: $581,000 - $616,000
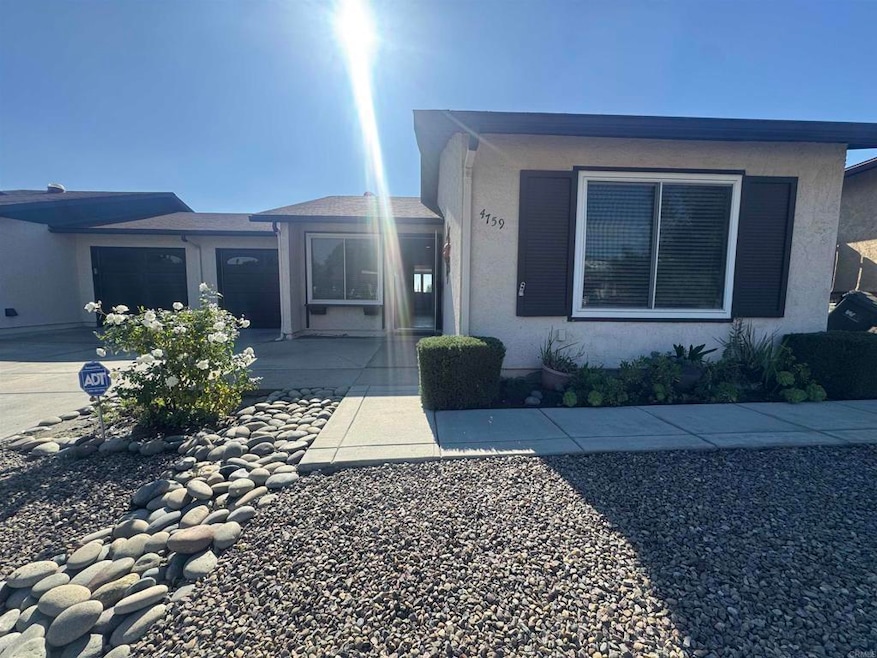
Professional photos coming soon! 55+ Community - Peacock Hills. Nestled on a peaceful cul-de-sac, this charming 2 bedroom, 1.5 bath Oceanside home is move-in ready with fresh interior paint and thoughtful updates throughout. The spacious, light-filled layout features an expansive living room, tile and hardwood flooring, and recessed lighting. The updated kitchen offers a gas stove, modern cabinetry, and an extended dining area that flows seamlessly into the home’s standout feature — a light filled sunroom overlooking the south-facing backyard. Enjoy indoor/outdoor living year-round with a covered patio, storage shed, and a low maintenance backyard perfect for gardening, complete with open views. Additional highlights include a new garage door motor, long driveway, 1-car garage with washer and dryer included, and a welcoming setting ideal for homeowners seeking comfort, functionality, and charm in a desirable location. This home is a fantastic opportunity with finishing touches in progress — don’t miss it!
Last Agent to Rent the Property
Covington & Associates Brokerage Email: bree@hansonrealtysd.com License #01962025 Listed on: 11/30/2025
Last Renter's Agent
Covington & Associates Brokerage Email: bree@hansonrealtysd.com License #01962025 Listed on: 11/30/2025
| Date | Buyer | Sale Price | Title Company |
|---|---|---|---|
| Colette C Kelley Trust | -- | Preston Estate Planning | |
| Kelley Colette | -- | None Available | |
| Corrigan Norma F | -- | None Available | |
| Corrigan Norma F | -- | None Available | |
| Corrigan Norma F | $150,000 | Chicago Title Company Escrow | |
| -- | $58,400 | -- |
| Date | Event | Price | List to Sale | Price per Sq Ft |
|---|---|---|---|---|
| 12/07/2025 12/07/25 | Rented | $2,900 | 0.0% | -- |
| 11/30/2025 11/30/25 | For Rent | $2,900 | -- | -- |
| Year | Tax Paid | Tax Assessment Tax Assessment Total Assessment is a certain percentage of the fair market value that is determined by local assessors to be the total taxable value of land and additions on the property. | Land | Improvement |
|---|---|---|---|---|
| 2025 | $2,213 | $201,335 | $115,302 | $86,033 |
| 2024 | $2,213 | $197,389 | $113,042 | $84,347 |
| 2023 | $2,160 | $193,520 | $110,826 | $82,694 |
| 2022 | $2,154 | $189,726 | $108,653 | $81,073 |
| 2021 | $2,107 | $186,007 | $106,523 | $79,484 |
| 2020 | $2,100 | $184,100 | $105,431 | $78,669 |
| 2019 | $2,070 | $180,491 | $103,364 | $77,127 |
| 2018 | $1,970 | $176,953 | $101,338 | $75,615 |
| 2017 | $1,934 | $173,484 | $99,351 | $74,133 |
| 2016 | $1,888 | $170,083 | $97,403 | $72,680 |
| 2015 | $1,805 | $167,529 | $95,940 | $71,589 |
| 2014 | $1,760 | $164,248 | $94,061 | $70,187 |
Landlord's Agent in 2025
Breanna Castro
Covington & Associates
(858) 248-7494
10 Total Sales
Source: California Regional Multiple Listing Service (CRMLS)
MLS Number: NDP2511137
APN: 161-343-55
Disclaimer: Certain information contained herein is derived from information provided by parties other than Homes.com. All information provided is deemed reliable, but is not guaranteed to be accurate and should be independently verified.
![]() The multiple listing data appearing on this website, or contained in reports produced therefrom, is owned and copyrighted by California Regional Multiple Listing Service, Inc. ("CRMLS") and is protected by all applicable copyright laws. Information provided is for viewer's personal, non-commercial use and may not be used for any purpose other than to identify prospective properties the viewer may be interested in purchasing. All listing data, including but not limited to square footage and lot size is believed to be accurate, but the listing Agent, listing Broker and CRMLS and its affiliates do not warrant or guarantee such accuracy. The viewer should independently verify the listed data prior to making any decisions based on such information by personal inspection and/or contacting a real estate professional.
The multiple listing data appearing on this website, or contained in reports produced therefrom, is owned and copyrighted by California Regional Multiple Listing Service, Inc. ("CRMLS") and is protected by all applicable copyright laws. Information provided is for viewer's personal, non-commercial use and may not be used for any purpose other than to identify prospective properties the viewer may be interested in purchasing. All listing data, including but not limited to square footage and lot size is believed to be accurate, but the listing Agent, listing Broker and CRMLS and its affiliates do not warrant or guarantee such accuracy. The viewer should independently verify the listed data prior to making any decisions based on such information by personal inspection and/or contacting a real estate professional.
Based on information from California Regional Multiple Listing Service, Inc. and /or other sources. All data, including all measurements and calculations of area, is obtained from various sources and has not been, and will not be, verified by broker or MLS. All information should be independently reviewed and verified for accuracy. Properties may or may not be listed by the office/agent presenting the information
Ask me questions while you tour the home.