Estimated Value: $191,000 - $199,000
3
Beds
2
Baths
1,376
Sq Ft
$141/Sq Ft
Est. Value
About This Home
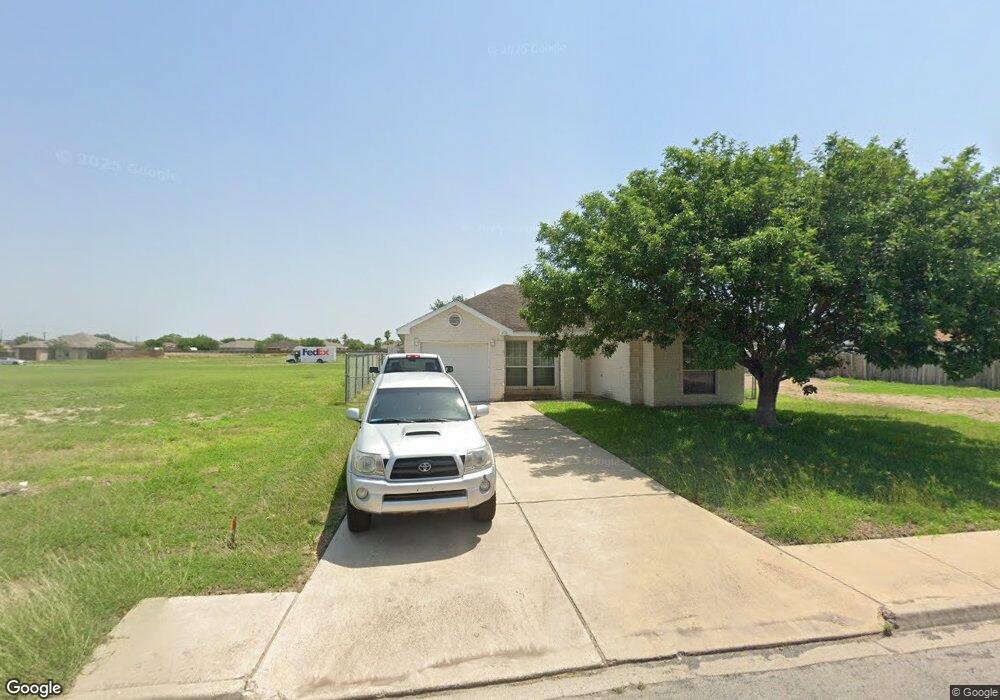
This home is located at 476 Serg Loop, Alamo, TX 78516 and is currently estimated at $194,337, approximately $141 per square foot. 476 Serg Loop is a home located in Hidalgo County with nearby schools including Capt. D. Salinas Elementary School, A.P. Solis Middle School, and Donna High School.
Ownership History
Date
Name
Owned For
Owner Type
Purchase Details
Closed on
Feb 16, 2023
Sold by
Vazquez Jose Luis Ramos and Vazquez Dora Elia
Bought by
Gonzalez Leocadio Carlos and Gonzalez Juana Vargas
Current Estimated Value
Purchase Details
Closed on
Jun 20, 2007
Sold by
Grande Valley Homes Llc
Bought by
Vazquez Jose Luis Ramos and Ibarra Dora Elia Ibarra
Home Financials for this Owner
Home Financials are based on the most recent Mortgage that was taken out on this home.
Original Mortgage
$82,380
Interest Rate
6.54%
Mortgage Type
Seller Take Back
Create a Home Valuation Report for This Property
The Home Valuation Report is an in-depth analysis detailing your home's value as well as a comparison with similar homes in the area
Home Values in the Area
Average Home Value in this Area
Purchase History
| Date | Buyer | Sale Price | Title Company |
|---|---|---|---|
| Gonzalez Leocadio Carlos | -- | Corporation Service | |
| Vazquez Jose Luis Ramos | -- | None Available |
Source: Public Records
Mortgage History
| Date | Status | Borrower | Loan Amount |
|---|---|---|---|
| Previous Owner | Vazquez Jose Luis Ramos | $82,380 |
Source: Public Records
Tax History
| Year | Tax Paid | Tax Assessment Tax Assessment Total Assessment is a certain percentage of the fair market value that is determined by local assessors to be the total taxable value of land and additions on the property. | Land | Improvement |
|---|---|---|---|---|
| 2025 | $2,678 | $167,068 | $45,000 | $122,068 |
| 2024 | $2,678 | $154,023 | $40,000 | $114,023 |
| 2023 | $3,953 | $155,318 | $40,000 | $115,318 |
| 2022 | $3,606 | $138,427 | $25,000 | $113,427 |
| 2021 | $3,108 | $118,447 | $25,000 | $93,447 |
| 2020 | $2,947 | $108,700 | $22,813 | $85,887 |
| 2019 | $2,518 | $91,822 | $22,813 | $69,009 |
| 2018 | $2,523 | $92,615 | $22,813 | $69,802 |
| 2017 | $2,422 | $87,783 | $17,188 | $70,595 |
| 2016 | $2,443 | $88,576 | $17,188 | $71,388 |
| 2015 | $2,312 | $90,162 | $17,188 | $72,974 |
Source: Public Records
Map
Nearby Homes
Your Personal Tour Guide
Ask me questions while you tour the home.