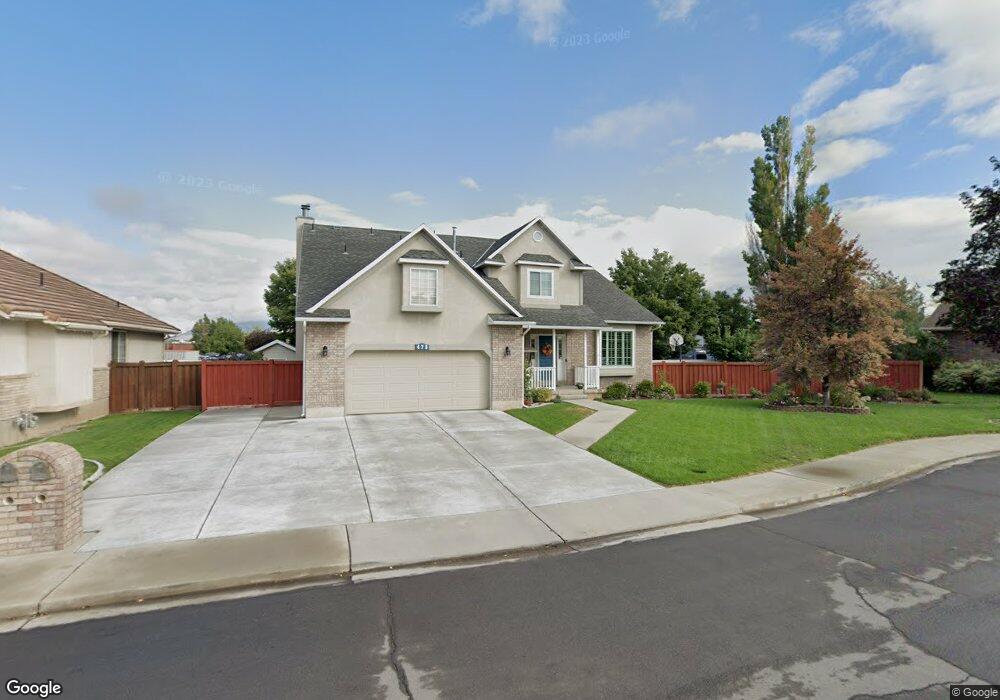
478 W 175 N Orem, UT 84057
Suncrest NeighborhoodEstimated Value: $654,000 - $666,022
6
Beds
4
Baths
3,603
Sq Ft
$183/Sq Ft
Est. Value
About This Home
This home is located at 478 W 175 N, Orem, UT 84057 and is currently estimated at $660,756, approximately $183 per square foot. 478 W 175 N is a home located in Utah County with nearby schools including Orem Junior High School, Mountain View High School, and Noah Webster Academy.
Ownership History
Date
Name
Owned For
Owner Type
Purchase Details
Closed on
Aug 28, 2002
Sold by
Bentley Alan R and Bentley Mary S
Bought by
Hall Brian G and Hall Reina L
Current Estimated Value
Home Financials for this Owner
Home Financials are based on the most recent Mortgage that was taken out on this home.
Original Mortgage
$192,000
Outstanding Balance
$81,316
Interest Rate
6.43%
Estimated Equity
$579,440
Purchase Details
Closed on
May 24, 2002
Sold by
Bentley Alan R
Bought by
Bentley Alan R and Bentley Mary S
Create a Home Valuation Report for This Property
The Home Valuation Report is an in-depth analysis detailing your home's value as well as a comparison with similar homes in the area
Home Values in the Area
Average Home Value in this Area
Purchase History
We collect this data history from publicly available records. To have your information removed, we recommend requesting removal directly through your county’s website.
| Date | Buyer | Sale Price | Title Company |
|---|---|---|---|
| Hall Brian G | -- | Provo Land Title Company | |
| Bentley Alan R | -- | First American Title Co | |
| Bentley Alan R | -- | First American Title Co |
Source: Public Records
Mortgage History
We collect this data history from publicly available records. To have your information removed, we recommend requesting removal directly through your county’s website.
| Date | Status | Borrower | Loan Amount |
|---|---|---|---|
| Open | Hall Brian G | $192,000 |
Source: Public Records
Tax History
| Year | Tax Paid | Tax Assessment Tax Assessment Total Assessment is a certain percentage of the fair market value that is determined by local assessors to be the total taxable value of land and additions on the property. | Land | Improvement |
|---|---|---|---|---|
| 2025 | $2,536 | $335,335 | -- | -- |
| 2024 | $2,536 | $310,090 | $0 | $0 |
| 2023 | $2,382 | $313,005 | $0 | $0 |
| 2022 | $2,271 | $289,190 | $0 | $0 |
| 2021 | $2,168 | $418,000 | $119,800 | $298,200 |
| 2020 | $2,033 | $385,300 | $95,800 | $289,500 |
| 2019 | $1,906 | $375,600 | $95,800 | $279,800 |
| 2018 | $1,847 | $347,800 | $88,500 | $259,300 |
| 2017 | $1,681 | $169,565 | $0 | $0 |
| 2016 | $1,771 | $164,725 | $0 | $0 |
| 2015 | $1,741 | $153,120 | $0 | $0 |
| 2014 | $1,694 | $148,335 | $0 | $0 |
Source: Public Records
Map
Nearby Homes
Your Personal Tour Guide
Ask me questions while you tour the home.