Estimated Value: $95,000 - $139,000
2
Beds
1
Bath
816
Sq Ft
$147/Sq Ft
Est. Value
About This Home
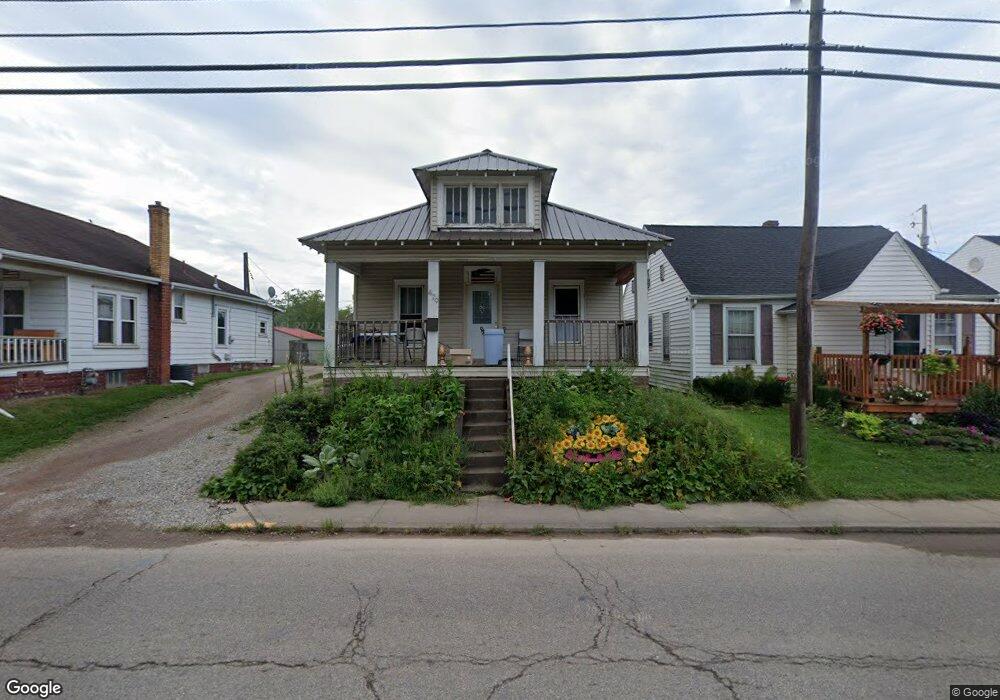
This home is located at 479 E Front St, Logan, OH 43138 and is currently estimated at $120,123, approximately $147 per square foot. 479 E Front St is a home located in Hocking County with nearby schools including Central Elementary School, St. John the Evangelist School, and Logan Christian School.
Ownership History
Date
Name
Owned For
Owner Type
Purchase Details
Closed on
Sep 8, 2017
Sold by
Cramblit Neva
Bought by
Massie Rae Ann
Current Estimated Value
Home Financials for this Owner
Home Financials are based on the most recent Mortgage that was taken out on this home.
Original Mortgage
$55,000
Outstanding Balance
$9,682
Interest Rate
3.92%
Mortgage Type
New Conventional
Estimated Equity
$110,441
Purchase Details
Closed on
Dec 8, 2014
Sold by
Massie Rae Ann
Bought by
Cramblit Neva
Purchase Details
Closed on
Nov 25, 2014
Sold by
Cramblit Neva
Bought by
Massie Rae Ann
Purchase Details
Closed on
Jul 22, 2005
Sold by
Massie Raymond W
Bought by
Ellinger Lawrence J and The Wayeline C Ellinger Living Trust
Purchase Details
Closed on
Sep 5, 2002
Sold by
Ellinger Lawrence J
Bought by
Massie Raymond W
Create a Home Valuation Report for This Property
The Home Valuation Report is an in-depth analysis detailing your home's value as well as a comparison with similar homes in the area
Home Values in the Area
Average Home Value in this Area
Purchase History
| Date | Buyer | Sale Price | Title Company |
|---|---|---|---|
| Massie Rae Ann | -- | None Available | |
| Cramblit Neva | -- | None Available | |
| Massie Rae Ann | -- | None Available | |
| Ellinger Lawrence J | $23,000 | None Available | |
| Massie Raymond W | $25,000 | None Available |
Source: Public Records
Mortgage History
| Date | Status | Borrower | Loan Amount |
|---|---|---|---|
| Open | Massie Rae Ann | $55,000 |
Source: Public Records
Tax History
| Year | Tax Paid | Tax Assessment Tax Assessment Total Assessment is a certain percentage of the fair market value that is determined by local assessors to be the total taxable value of land and additions on the property. | Land | Improvement |
|---|---|---|---|---|
| 2025 | $968 | $26,810 | $5,950 | $20,860 |
| 2024 | $787 | $19,500 | $4,480 | $15,020 |
| 2023 | $787 | $19,500 | $4,480 | $15,020 |
| 2022 | $788 | $19,500 | $4,480 | $15,020 |
| 2021 | $712 | $16,320 | $3,530 | $12,790 |
| 2020 | $712 | $16,320 | $3,530 | $12,790 |
| 2019 | $712 | $16,320 | $3,530 | $12,790 |
| 2018 | $482 | $11,240 | $3,050 | $8,190 |
| 2017 | $455 | $11,240 | $3,050 | $8,190 |
| 2016 | $452 | $11,240 | $3,050 | $8,190 |
| 2015 | $381 | $9,130 | $2,380 | $6,750 |
| 2014 | $381 | $9,130 | $2,380 | $6,750 |
| 2013 | $372 | $9,130 | $2,380 | $6,750 |
Source: Public Records
Map
Nearby Homes
- 90 S Culver St
- 600 E 2nd St
- 156 Zanesville Ave
- State Route 328
- 882 E Main St
- 448 N Walnut St
- 538 Kerlin Ave
- 28578 Hawthorne Way
- 28654 Hawthorne Way Unit Lot 8
- 75 Hill St
- 621 N Walnut St
- 229 N Spring St
- 226 W Front St
- 235 W Main St
- 846 Elizabeth Ave
- 733 Walnut Dr
- 168 Fountain St
- 180 Gallagher Ave
- 849 Mohican Ave
- 385 W Main St
Your Personal Tour Guide
Ask me questions while you tour the home.