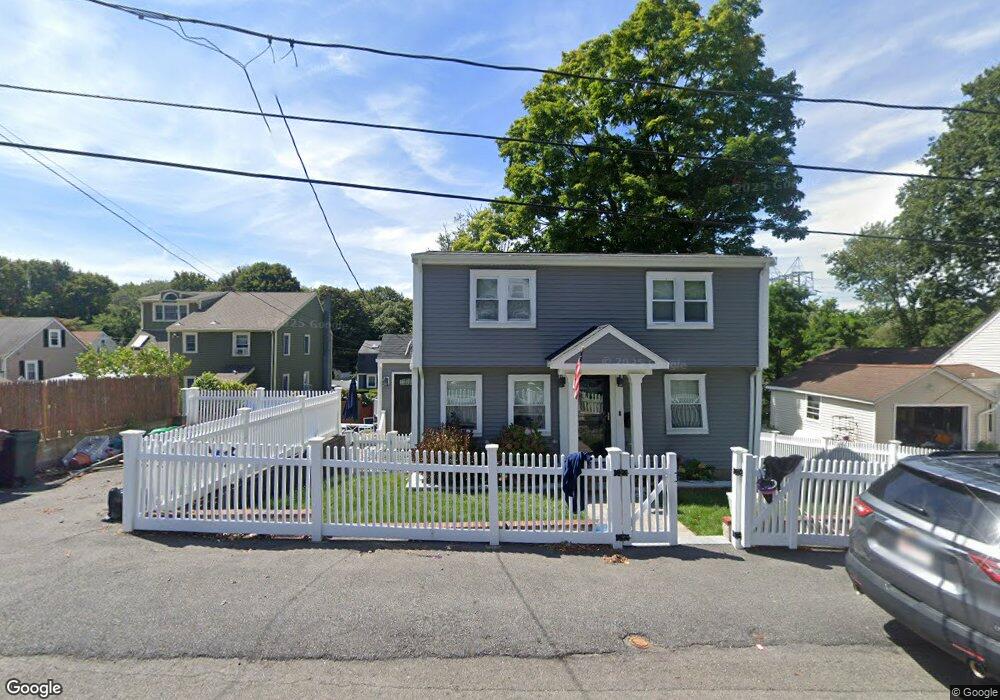
48 4th Ave Weymouth, MA 02188
Weymouth Landing NeighborhoodEstimated Value: $538,091 - $606,000
2
Beds
2
Baths
1,316
Sq Ft
$425/Sq Ft
Est. Value
About This Home
This home is located at 48 4th Ave, Weymouth, MA 02188 and is currently estimated at $559,273, approximately $424 per square foot. 48 4th Ave is a home located in Norfolk County with nearby schools including Abigail Adams Middle School, Academy Avenue Elementary School, and Weymouth Middle School Chapman.
Ownership History
Date
Name
Owned For
Owner Type
Purchase Details
Closed on
Oct 23, 2014
Sold by
Mellor Elizabeth
Bought by
Mellor Elizabeth and Mellor Thomas R
Current Estimated Value
Home Financials for this Owner
Home Financials are based on the most recent Mortgage that was taken out on this home.
Original Mortgage
$150,000
Outstanding Balance
$114,997
Interest Rate
4.1%
Mortgage Type
New Conventional
Estimated Equity
$444,276
Create a Home Valuation Report for This Property
The Home Valuation Report is an in-depth analysis detailing your home's value as well as a comparison with similar homes in the area
Home Values in the Area
Average Home Value in this Area
Purchase History
| Date | Buyer | Sale Price | Title Company |
|---|---|---|---|
| Mellor Elizabeth | -- | -- |
Source: Public Records
Mortgage History
| Date | Status | Borrower | Loan Amount |
|---|---|---|---|
| Open | Mellor Elizabeth | $150,000 |
Source: Public Records
Tax History
| Year | Tax Paid | Tax Assessment Tax Assessment Total Assessment is a certain percentage of the fair market value that is determined by local assessors to be the total taxable value of land and additions on the property. | Land | Improvement |
|---|---|---|---|---|
| 2025 | $4,821 | $477,300 | $221,100 | $256,200 |
| 2024 | $4,670 | $454,700 | $210,600 | $244,100 |
| 2023 | $4,400 | $421,100 | $195,000 | $226,100 |
| 2022 | $4,306 | $375,700 | $180,500 | $195,200 |
| 2021 | $4,040 | $344,100 | $180,500 | $163,600 |
| 2020 | $3,842 | $322,300 | $180,500 | $141,800 |
| 2019 | $3,750 | $309,400 | $173,600 | $135,800 |
| 2018 | $3,640 | $291,200 | $165,300 | $125,900 |
| 2017 | $3,555 | $277,500 | $157,500 | $120,000 |
| 2016 | $3,446 | $269,200 | $151,400 | $117,800 |
| 2015 | $3,273 | $253,700 | $144,500 | $109,200 |
| 2014 | $3,103 | $233,300 | $134,500 | $98,800 |
Source: Public Records
Map
Nearby Homes
- 80 Manzanetta Ave
- 70 Biscayne Ave
- 211 Roosevelt Rd
- 87 Arborway Dr
- 70 Colonial Rd
- 29 Church St Unit 22
- 67 Trefton Dr
- 25 Richmond St
- 54 Edgemont Rd
- 82 Cotton Ave
- 29 Arnold Rd
- 140 Commercial St
- 148 Chard St
- 38 Saunders St
- 41 Lantern Ln
- 37 Lantern Ln
- 90 Sea St Unit 204
- 33 Congress St
- 951 Commercial St
- 14 Crescent Rd
Your Personal Tour Guide
Ask me questions while you tour the home.