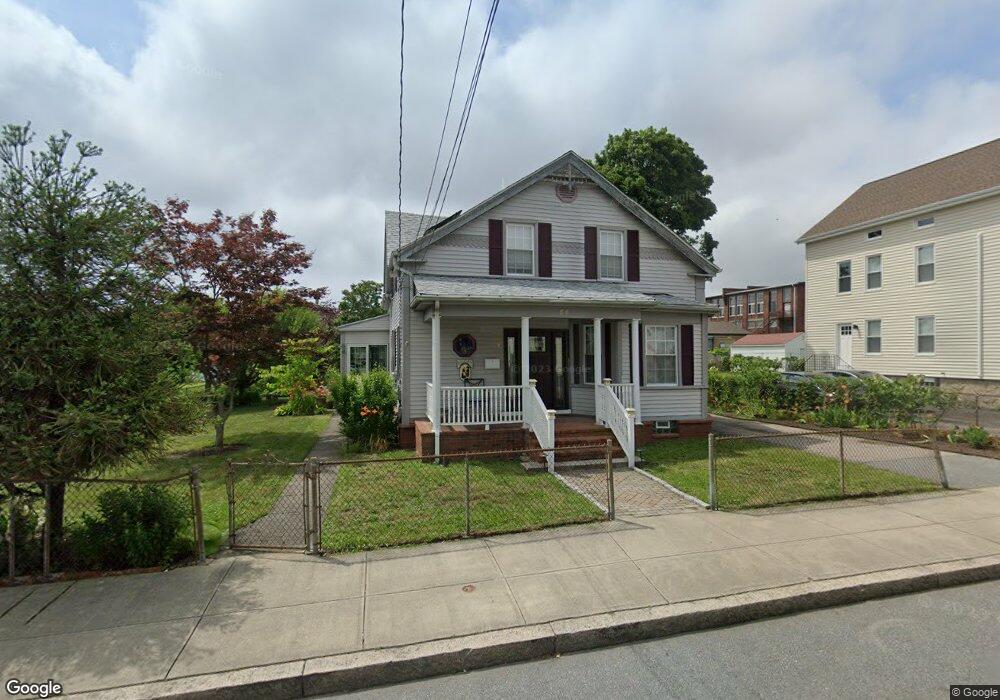
48 Almy St Fall River, MA 02720
Western Fall River NeighborhoodEstimated Value: $455,000 - $494,000
3
Beds
2
Baths
2,080
Sq Ft
$229/Sq Ft
Est. Value
About This Home
This home is located at 48 Almy St, Fall River, MA 02720 and is currently estimated at $476,141, approximately $228 per square foot. 48 Almy St is a home located in Bristol County with nearby schools including Spencer Borden Elementary School, Morton Middle School, and B M C Durfee High School.
Ownership History
Date
Name
Owned For
Owner Type
Purchase Details
Closed on
Jul 3, 1989
Sold by
Silvia Joseph
Bought by
Martims Joseph M
Current Estimated Value
Create a Home Valuation Report for This Property
The Home Valuation Report is an in-depth analysis detailing your home's value as well as a comparison with similar homes in the area
Home Values in the Area
Average Home Value in this Area
Purchase History
We collect this data history from publicly available records. To have your information removed, we recommend requesting removal directly through your county’s website.
| Date | Buyer | Sale Price | Title Company |
|---|---|---|---|
| Martims Joseph M | $140,000 | -- |
Source: Public Records
Mortgage History
We collect this data history from publicly available records. To have your information removed, we recommend requesting removal directly through your county’s website.
| Date | Status | Borrower | Loan Amount |
|---|---|---|---|
| Open | Martims Joseph M | $91,800 | |
| Closed | Martims Joseph M | $15,000 |
Source: Public Records
Tax History
| Year | Tax Paid | Tax Assessment Tax Assessment Total Assessment is a certain percentage of the fair market value that is determined by local assessors to be the total taxable value of land and additions on the property. | Land | Improvement |
|---|---|---|---|---|
| 2025 | $4,893 | $427,300 | $130,900 | $296,400 |
| 2024 | $4,611 | $401,300 | $125,900 | $275,400 |
| 2023 | $4,334 | $353,200 | $107,900 | $245,300 |
| 2022 | $4,004 | $317,300 | $98,100 | $219,200 |
| 2021 | $3,563 | $257,600 | $90,800 | $166,800 |
| 2020 | $3,559 | $246,300 | $86,900 | $159,400 |
| 2019 | $3,416 | $234,300 | $82,800 | $151,500 |
| 2018 | $3,121 | $213,500 | $81,200 | $132,300 |
| 2017 | $2,999 | $214,200 | $82,900 | $131,300 |
| 2016 | $2,881 | $211,400 | $86,300 | $125,100 |
| 2015 | $2,723 | $208,200 | $83,100 | $125,100 |
| 2014 | $2,675 | $212,600 | $87,500 | $125,100 |
Source: Public Records
Map
Nearby Homes
- 88 Almy St
- 70 N Court St Unit f
- 195 Brownell St
- 11 Dyer St
- 36 Mcclure Place
- 801 N Main St
- 1576 N Main St
- 109 Saint Mary St
- 750 Davol St Unit 321
- 750 Davol St Unit 519
- 750 Davol St Unit 318
- 724 High St
- 710 High St
- 613 Durfee St
- 301 Madison St
- 554 Madison St
- 574 Durfee St
- 1231 Robeson St
- 339 Danforth St Unit 6
- 337 Danforth St Unit 7
Your Personal Tour Guide
Ask me questions while you tour the home.