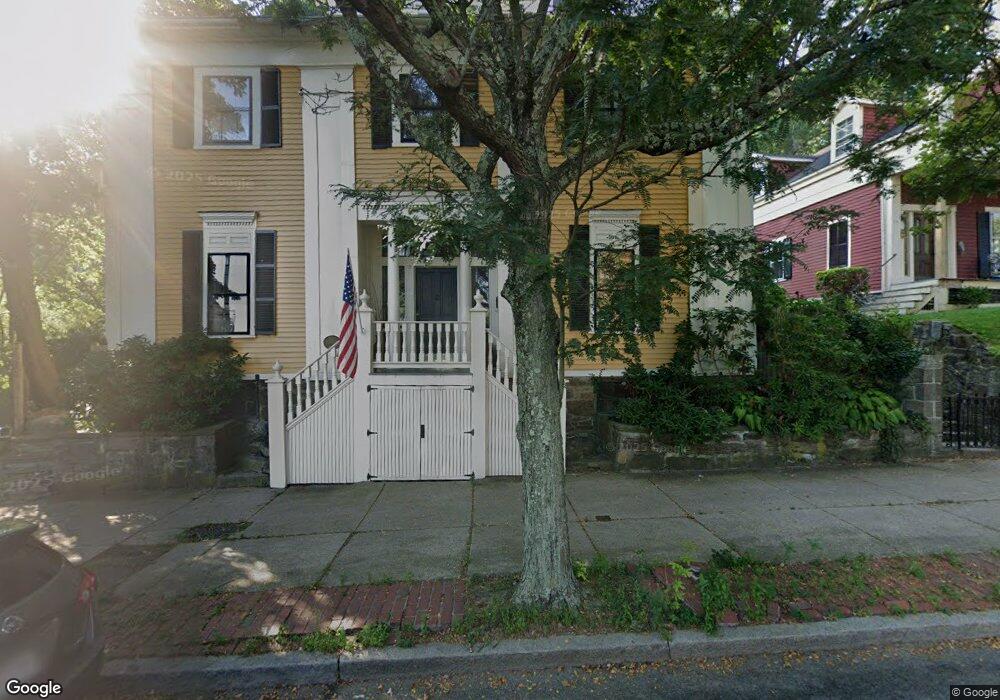
48 Centre St Roxbury, MA 02119
Fort Hill NeighborhoodEstimated Value: $1,085,000 - $1,383,000
4
Beds
3
Baths
3,980
Sq Ft
$314/Sq Ft
Est. Value
About This Home
This home is located at 48 Centre St, Roxbury, MA 02119 and is currently estimated at $1,249,682, approximately $313 per square foot. 48 Centre St is a home located in Suffolk County with nearby schools including Paige Academy, Malik Academy, and Manville School.
Ownership History
Date
Name
Owned For
Owner Type
Purchase Details
Closed on
Nov 27, 2002
Sold by
Kruecki Walter J
Bought by
Berger Lisa M and Blank Edward
Current Estimated Value
Home Financials for this Owner
Home Financials are based on the most recent Mortgage that was taken out on this home.
Original Mortgage
$500,000
Outstanding Balance
$199,652
Interest Rate
6.16%
Mortgage Type
Purchase Money Mortgage
Estimated Equity
$1,050,030
Create a Home Valuation Report for This Property
The Home Valuation Report is an in-depth analysis detailing your home's value as well as a comparison with similar homes in the area
Home Values in the Area
Average Home Value in this Area
Purchase History
| Date | Buyer | Sale Price | Title Company |
|---|---|---|---|
| Berger Lisa M | $648,500 | -- |
Source: Public Records
Mortgage History
| Date | Status | Borrower | Loan Amount |
|---|---|---|---|
| Open | Berger Lisa M | $500,000 | |
| Previous Owner | Berger Lisa M | $100,000 | |
| Previous Owner | Berger Lisa M | $40,000 | |
| Previous Owner | Berger Lisa M | $100,000 |
Source: Public Records
Tax History
| Year | Tax Paid | Tax Assessment Tax Assessment Total Assessment is a certain percentage of the fair market value that is determined by local assessors to be the total taxable value of land and additions on the property. | Land | Improvement |
|---|---|---|---|---|
| 2025 | $12,523 | $1,081,400 | $423,400 | $658,000 |
| 2024 | $9,975 | $915,100 | $268,700 | $646,400 |
| 2023 | $9,450 | $879,900 | $258,400 | $621,500 |
| 2022 | $8,703 | $799,900 | $234,900 | $565,000 |
| 2021 | $7,977 | $747,600 | $219,500 | $528,100 |
| 2020 | $7,435 | $704,100 | $209,900 | $494,200 |
| 2019 | $6,710 | $636,600 | $160,700 | $475,900 |
| 2018 | $6,180 | $589,700 | $160,700 | $429,000 |
| 2017 | $6,185 | $584,000 | $160,700 | $423,300 |
| 2016 | $5,795 | $526,800 | $160,700 | $366,100 |
| 2015 | $4,811 | $397,300 | $108,600 | $288,700 |
| 2014 | $4,544 | $361,200 | $108,600 | $252,600 |
Source: Public Records
Map
Nearby Homes
- 10 Linwood St
- 6 Millmont St Unit 6
- 19-21 Norfolk St Unit 1
- 80 Terrace St Unit 501
- 134 Terrace St
- 10-18 John Eliot Square Unit 3D
- 78 Fort Ave Unit 78
- 25 Fort Ave Unit 1
- 27 Guild St Unit 102
- 27 Guild St Unit 101
- 27 Dudley St
- 156 Terrace St Unit 402
- 841 Parker St Unit 203
- 841 Parker St Unit 101
- 39 Hawthorne St Unit 39
- 63 Beech Glen St
- 187 Highland St
- 9 W Cedar St
- 6 Harleston St Unit 6
- 52 Fisher Ave Unit 302
- 64 Centre St
- 24 Linwood Square
- 26 Linwood Square
- 20 Linwood Square
- 61 Centre St Unit 2
- 61 Centre St
- 59 Centre St
- 14 Linwood Square
- 51-53 Linwood St
- 51 Linwood St Unit 53
- 47 Centre St Unit 1
- 47 Centre St
- 1 Centre Place
- 12 Linwood Square
- 67 Centre St
- 3 Centre Place
- 10 Linwood Square
- 10 Linwood Square Unit B
- 10 Linwood Square Unit 4
- 10 Linwood Square Unit 2A
Your Personal Tour Guide
Ask me questions while you tour the home.