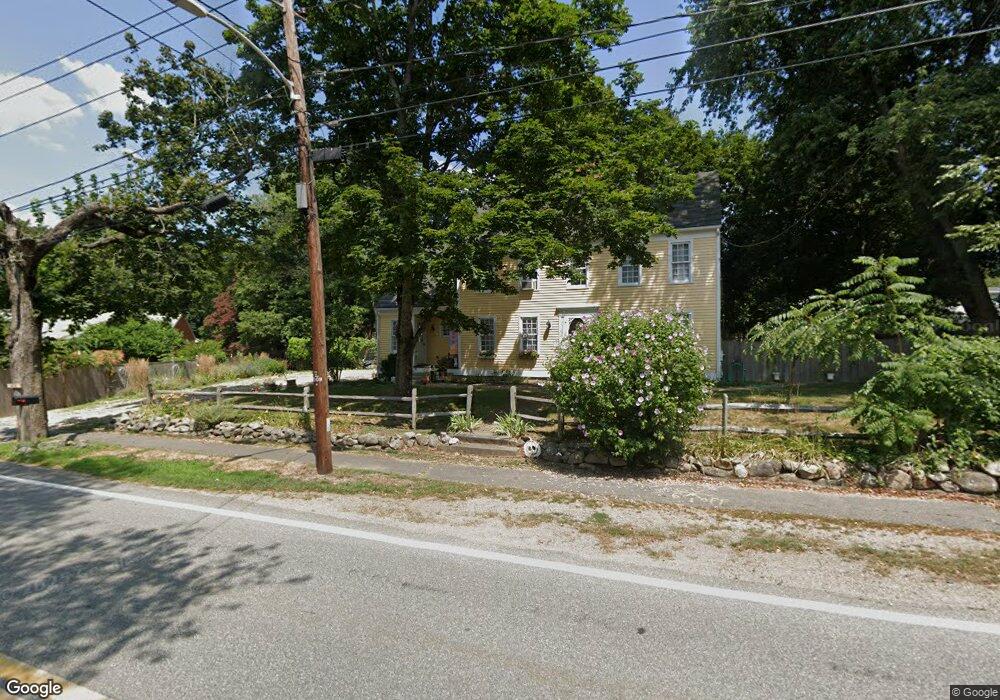
48 Cherry St Wenham, MA 01984
Estimated Value: $1,063,579 - $1,362,000
3
Beds
4
Baths
2,657
Sq Ft
$445/Sq Ft
Est. Value
About This Home
This home is located at 48 Cherry St, Wenham, MA 01984 and is currently estimated at $1,182,145, approximately $444 per square foot. 48 Cherry St is a home located in Essex County with nearby schools including Winthrop School, Bessie Buker Elementary School, and Cutler Elementary School.
Ownership History
Date
Name
Owned For
Owner Type
Purchase Details
Closed on
Mar 16, 1993
Sold by
Markarian William D and Markarian Laurie
Bought by
Mullin Edmund L and Mullin Cathy G
Current Estimated Value
Purchase Details
Closed on
Mar 24, 1987
Sold by
Gray Ruth E
Bought by
K&B Rlty Trust
Create a Home Valuation Report for This Property
The Home Valuation Report is an in-depth analysis detailing your home's value as well as a comparison with similar homes in the area
Home Values in the Area
Average Home Value in this Area
Purchase History
| Date | Buyer | Sale Price | Title Company |
|---|---|---|---|
| Mullin Edmund L | $228,000 | -- | |
| K&B Rlty Trust | $136,000 | -- |
Source: Public Records
Mortgage History
| Date | Status | Borrower | Loan Amount |
|---|---|---|---|
| Open | K&B Rlty Trust | $295,000 | |
| Closed | K&B Rlty Trust | $50,000 |
Source: Public Records
Tax History
| Year | Tax Paid | Tax Assessment Tax Assessment Total Assessment is a certain percentage of the fair market value that is determined by local assessors to be the total taxable value of land and additions on the property. | Land | Improvement |
|---|---|---|---|---|
| 2025 | $13,849 | $891,200 | $470,400 | $420,800 |
| 2024 | $13,551 | $865,300 | $470,400 | $394,900 |
| 2023 | $12,816 | $738,700 | $441,800 | $296,900 |
| 2022 | $11,728 | $599,000 | $303,000 | $296,000 |
| 2021 | $11,346 | $576,500 | $280,500 | $296,000 |
| 2020 | $10,286 | $543,100 | $284,200 | $258,900 |
| 2019 | $9,787 | $543,100 | $284,200 | $258,900 |
| 2018 | $9,209 | $490,100 | $275,100 | $215,000 |
| 2017 | $8,984 | $490,100 | $275,100 | $215,000 |
| 2016 | $8,322 | $490,100 | $275,100 | $215,000 |
| 2015 | $7,558 | $465,100 | $250,100 | $215,000 |
Source: Public Records
Map
Nearby Homes
Your Personal Tour Guide
Ask me questions while you tour the home.