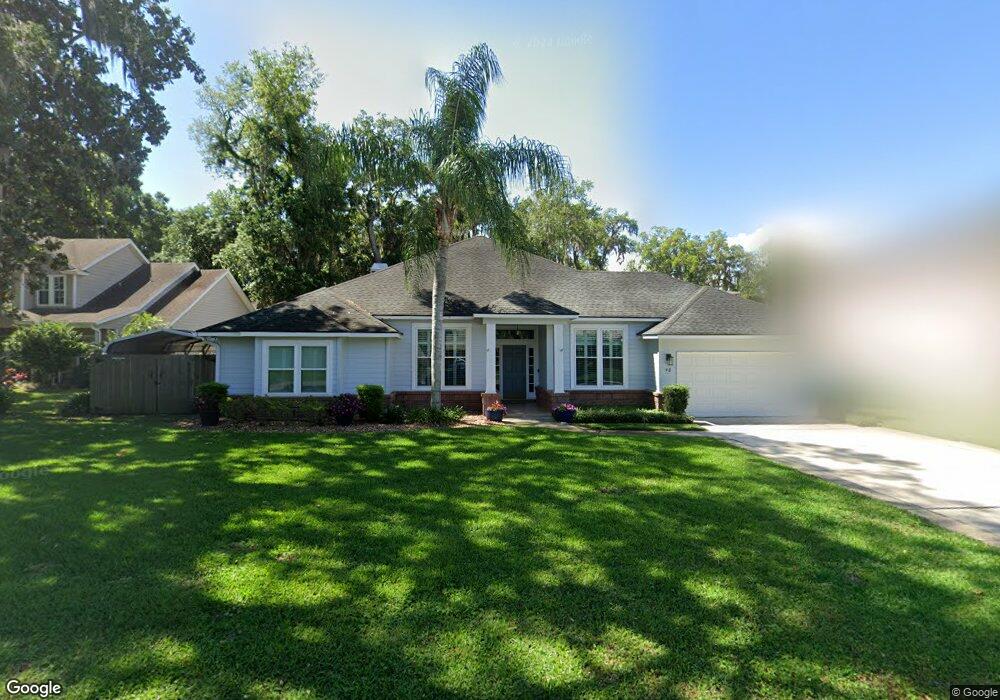
48 Cilewood Ct Jacksonville Beach, FL 32250
Estimated Value: $710,000 - $1,025,000
4
Beds
2
Baths
2,376
Sq Ft
$379/Sq Ft
Est. Value
About This Home
This home is located at 48 Cilewood Ct, Jacksonville Beach, FL 32250 and is currently estimated at $900,146, approximately $378 per square foot. 48 Cilewood Ct is a home located in Duval County with nearby schools including San Pablo Elementary School, Duncan U. Fletcher Middle School, and Duncan U. Fletcher High School.
Ownership History
Date
Name
Owned For
Owner Type
Purchase Details
Closed on
Dec 17, 2004
Sold by
Tarver Joseph A and Tarver Elizabeth H
Bought by
Strickland Kevin L and Strickland Darlene M
Current Estimated Value
Home Financials for this Owner
Home Financials are based on the most recent Mortgage that was taken out on this home.
Original Mortgage
$247,500
Outstanding Balance
$120,813
Interest Rate
5.66%
Mortgage Type
New Conventional
Estimated Equity
$779,333
Create a Home Valuation Report for This Property
The Home Valuation Report is an in-depth analysis detailing your home's value as well as a comparison with similar homes in the area
Home Values in the Area
Average Home Value in this Area
Purchase History
| Date | Buyer | Sale Price | Title Company |
|---|---|---|---|
| Strickland Kevin L | $387,500 | -- |
Source: Public Records
Mortgage History
| Date | Status | Borrower | Loan Amount |
|---|---|---|---|
| Open | Strickland Kevin L | $247,500 | |
| Closed | Strickland Kevin L | $20,000 |
Source: Public Records
Tax History
| Year | Tax Paid | Tax Assessment Tax Assessment Total Assessment is a certain percentage of the fair market value that is determined by local assessors to be the total taxable value of land and additions on the property. | Land | Improvement |
|---|---|---|---|---|
| 2026 | $6,081 | $371,553 | -- | -- |
| 2025 | $5,935 | $371,553 | -- | -- |
| 2024 | $5,769 | $361,082 | -- | -- |
| 2023 | $5,769 | $350,566 | $0 | $0 |
| 2022 | $5,286 | $340,356 | $0 | $0 |
| 2021 | $5,251 | $330,443 | $0 | $0 |
| 2020 | $5,199 | $325,881 | $0 | $0 |
| 2019 | $5,141 | $318,555 | $0 | $0 |
| 2018 | $5,075 | $312,616 | $0 | $0 |
| 2017 | $5,013 | $306,187 | $0 | $0 |
| 2016 | $4,935 | $299,890 | $0 | $0 |
| 2015 | $5,009 | $297,806 | $0 | $0 |
| 2014 | $5,043 | $295,443 | $0 | $0 |
Source: Public Records
Map
Nearby Homes
- 40 Tallwood Rd
- 53 Tallwood Rd
- 83 Tallwood Rd
- 2041 Waterway Island Ln
- 1833 Kings Ct
- 2280 Oak Forest Dr
- 1901 Tanglewood Rd
- 2029 Shadow Ln
- 2010 Shadow Ln
- 1216 21st St N
- 1911 Tanglewood Rd
- 1819 Twelve Oaks Ln W
- 1207 19th St N
- 1907 Penman Rd
- 1007 21st St N
- 1419 Forest Marsh Dr
- 1516 12th Ave N
- 1203 16th Ave N
- 1211 Penman Rd
- 1052 Penman Rd
Your Personal Tour Guide
Ask me questions while you tour the home.