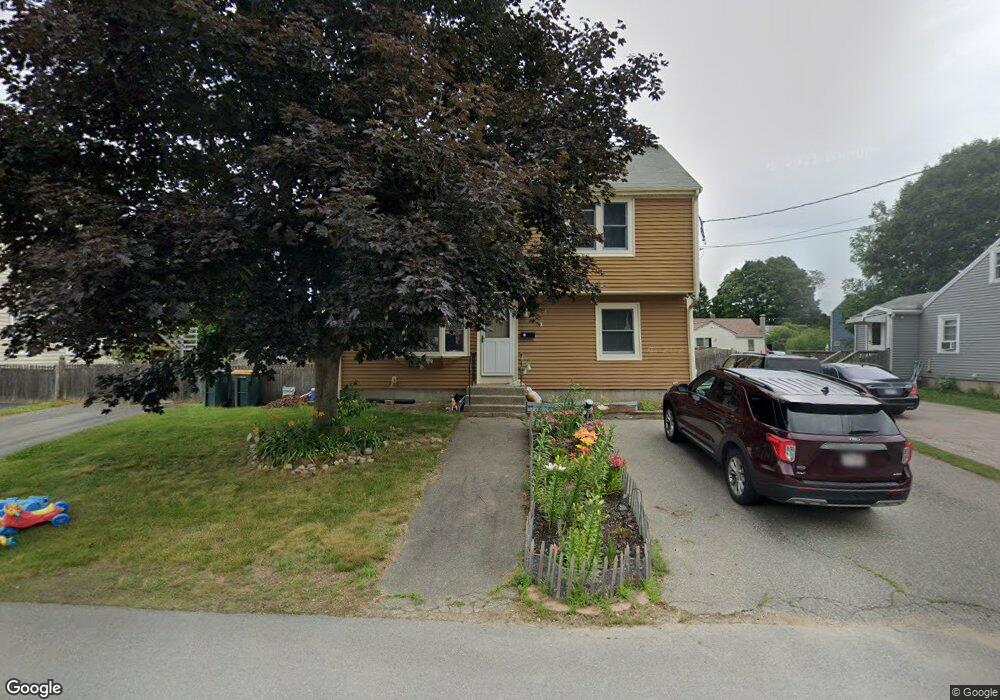
48 Doris Dr Abington, MA 02351
Estimated Value: $534,000 - $579,000
3
Beds
2
Baths
1,698
Sq Ft
$330/Sq Ft
Est. Value
About This Home
This home is located at 48 Doris Dr, Abington, MA 02351 and is currently estimated at $559,624, approximately $329 per square foot. 48 Doris Dr is a home located in Plymouth County with nearby schools including Beaver Brook Elementary School, Abington Middle School, and Woodsdale School.
Ownership History
Date
Name
Owned For
Owner Type
Purchase Details
Closed on
Aug 5, 2019
Sold by
Caseley Michael D
Bought by
Caseley Michael D and Caseley Jennifer J
Current Estimated Value
Purchase Details
Closed on
Jul 14, 2015
Sold by
Caseley Norman H and Caseley Helen R
Bought by
Caseley Helen R
Purchase Details
Closed on
May 12, 1986
Bought by
Caseley Helen R
Create a Home Valuation Report for This Property
The Home Valuation Report is an in-depth analysis detailing your home's value as well as a comparison with similar homes in the area
Home Values in the Area
Average Home Value in this Area
Purchase History
We collect this data history from publicly available records. To have your information removed, we recommend requesting removal directly through your county’s website.
| Date | Buyer | Sale Price | Title Company |
|---|---|---|---|
| Caseley Michael D | -- | -- | |
| Caseley Michael D | -- | -- | |
| Caseley Helen R | -- | -- | |
| Caseley Helen R | $97,000 | -- |
Source: Public Records
Mortgage History
We collect this data history from publicly available records. To have your information removed, we recommend requesting removal directly through your county’s website.
| Date | Status | Borrower | Loan Amount |
|---|---|---|---|
| Previous Owner | Caseley Helen R | $116,000 | |
| Previous Owner | Caseley Helen R | $18,000 | |
| Previous Owner | Caseley Helen R | $92,000 |
Source: Public Records
Tax History
| Year | Tax Paid | Tax Assessment Tax Assessment Total Assessment is a certain percentage of the fair market value that is determined by local assessors to be the total taxable value of land and additions on the property. | Land | Improvement |
|---|---|---|---|---|
| 2025 | $6,206 | $475,200 | $212,000 | $263,200 |
| 2024 | $6,000 | $448,400 | $192,700 | $255,700 |
| 2023 | $5,609 | $394,700 | $167,600 | $227,100 |
| 2022 | $5,574 | $366,200 | $146,600 | $219,600 |
| 2021 | $5,315 | $322,500 | $133,000 | $189,500 |
| 2020 | $5,510 | $324,100 | $139,600 | $184,500 |
| 2019 | $5,287 | $304,000 | $133,000 | $171,000 |
| 2018 | $5,075 | $284,800 | $133,000 | $151,800 |
| 2017 | $5,011 | $273,100 | $133,000 | $140,100 |
| 2016 | $4,669 | $260,400 | $126,700 | $133,700 |
| 2015 | $4,320 | $254,100 | $126,700 | $127,400 |
Source: Public Records
Map
Nearby Homes
Your Personal Tour Guide
Ask me questions while you tour the home.