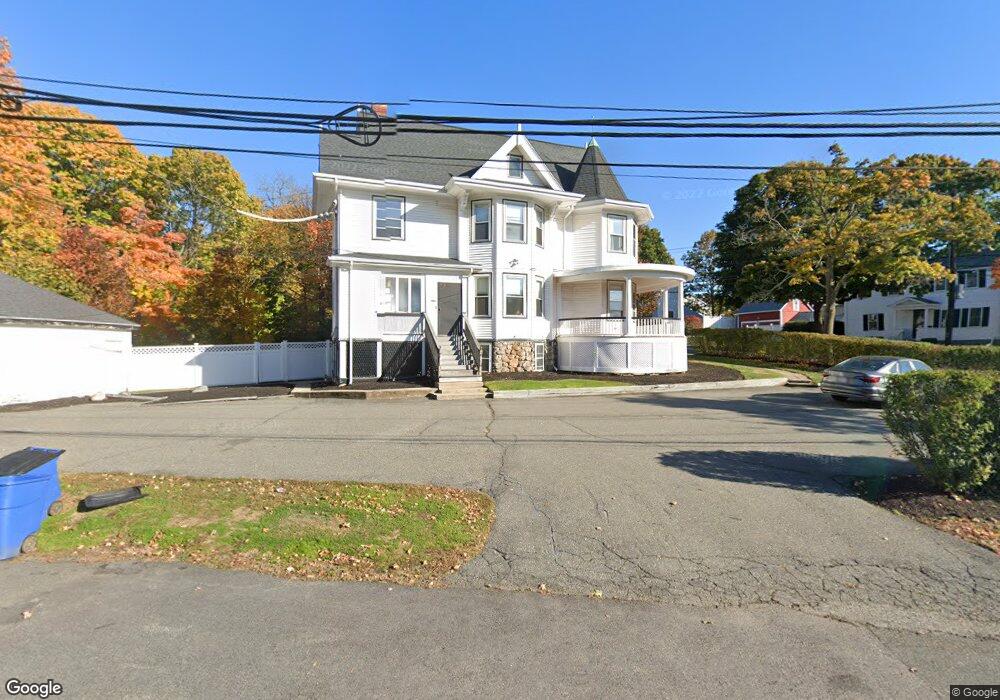
48 Elm St Stoneham, MA 02180
Bear Hill NeighborhoodEstimated Value: $1,018,932
Studio
2
Baths
4,574
Sq Ft
$223/Sq Ft
Est. Value
About This Home
This home is located at 48 Elm St, Stoneham, MA 02180 and is currently estimated at $1,018,932, approximately $222 per square foot. 48 Elm St is a home located in Middlesex County with nearby schools including Stoneham High School, St. Patrick Elementary School, and St Joseph School.
Ownership History
Date
Name
Owned For
Owner Type
Purchase Details
Closed on
Oct 1, 2015
Sold by
Compass Rt and Swansburg
Bought by
Bandy Llc
Current Estimated Value
Home Financials for this Owner
Home Financials are based on the most recent Mortgage that was taken out on this home.
Original Mortgage
$475,000
Outstanding Balance
$367,393
Interest Rate
3.95%
Mortgage Type
Commercial
Estimated Equity
$651,539
Create a Home Valuation Report for This Property
The Home Valuation Report is an in-depth analysis detailing your home's value as well as a comparison with similar homes in the area
Home Values in the Area
Average Home Value in this Area
Purchase History
| Date | Buyer | Sale Price | Title Company |
|---|---|---|---|
| Bandy Llc | $549,500 | -- |
Source: Public Records
Mortgage History
| Date | Status | Borrower | Loan Amount |
|---|---|---|---|
| Open | Bandy Llc | $475,000 |
Source: Public Records
Tax History
| Year | Tax Paid | Tax Assessment Tax Assessment Total Assessment is a certain percentage of the fair market value that is determined by local assessors to be the total taxable value of land and additions on the property. | Land | Improvement |
|---|---|---|---|---|
| 2025 | $15,417 | $794,700 | $456,200 | $338,500 |
| 2024 | $15,374 | $762,200 | $433,400 | $328,800 |
| 2023 | $15,254 | $720,900 | $404,900 | $316,000 |
| 2022 | $13,334 | $673,100 | $387,800 | $285,300 |
| 2021 | $13,288 | $648,200 | $387,800 | $260,400 |
| 2020 | $13,288 | $648,200 | $387,800 | $260,400 |
| 2019 | $13,210 | $619,300 | $365,000 | $254,300 |
| 2018 | $9,648 | $608,200 | $365,000 | $243,200 |
| 2017 | $2,862 | $558,500 | $319,400 | $239,100 |
| 2016 | $12,360 | $548,100 | $319,400 | $228,700 |
| 2015 | $11,093 | $502,400 | $273,700 | $228,700 |
| 2014 | $10,553 | $479,700 | $250,900 | $228,800 |
Source: Public Records
Map
Nearby Homes
- 1 Tremont St
- 4 Wescott Rd
- 58 Washington St
- 10 Pomeworth St Unit A
- 4 Garfield Ave
- 159 Main St Unit 27C
- 159 Main St Unit 39A
- 8 Steele St
- 36 Pleasant St Unit B
- 2 Pine St Unit 3
- 23 Sunrise Ave
- 62 High St Unit Lot 8
- 62 High St Unit 4
- 62 High St Unit Lot 5
- 62 High St Unit Lot 7
- 62 High St Unit Lot 12
- 62 High St Unit 3
- 18 Hersam St
- 4 Magnolia Terrace
- 51 Spring St
Your Personal Tour Guide
Ask me questions while you tour the home.