48 Francis St Chicopee, MA 01013
Chicopee Center NeighborhoodEstimated Value: $330,343 - $364,000
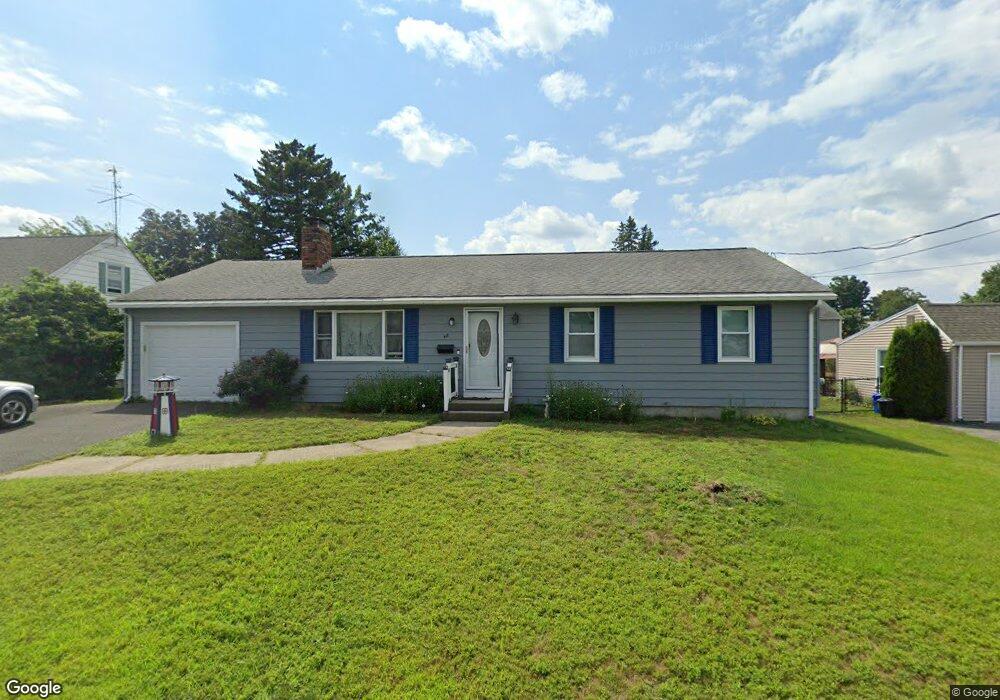
About This Home
This home is located at 48 Francis St, Chicopee, MA 01013 and is currently estimated at $342,336, approximately $254 per square foot. 48 Francis St is a home located in Hampden County with nearby schools including Bowe Elementary School, Fairview Middle School, and Chicopee High School.
Ownership History
We collect this data history from publicly available records. To have your information removed, we recommend requesting removal directly through your county’s website.
Purchase Details
Purchase Details
Home Financials for this Owner
Home Financials are based on the most recent Mortgage that was taken out on this home.Home Values in the Area
Average Home Value in this Area
Purchase History
We collect this data history from publicly available records. To have your information removed, we recommend requesting removal directly through your county’s website.
| Date | Buyer | Sale Price | Title Company |
|---|---|---|---|
| -- | -- | ||
| $180,000 | -- |
Mortgage History
We collect this data history from publicly available records. To have your information removed, we recommend requesting removal directly through your county’s website.
| Date | Status | Borrower | Loan Amount |
|---|---|---|---|
| Previous Owner | $130,000 |
Tax History
We collect this data history from publicly available records. To have your information removed, we recommend requesting removal directly through your county’s website.
| Year | Tax Paid | Tax Assessment Tax Assessment Total Assessment is a certain percentage of the fair market value that is determined by local assessors to be the total taxable value of land and additions on the property. | Land | Improvement |
|---|---|---|---|---|
| 2025 | $4,157 | $274,200 | $88,500 | $185,700 |
| 2024 | $3,939 | $266,900 | $86,800 | $180,100 |
| 2023 | $3,719 | $245,500 | $78,900 | $166,600 |
| 2022 | $3,529 | $207,700 | $68,600 | $139,100 |
| 2021 | $3,344 | $189,900 | $62,400 | $127,500 |
| 2020 | $3,138 | $179,700 | $62,400 | $117,300 |
| 2019 | $3,073 | $171,100 | $62,400 | $108,700 |
| 2018 | $2,999 | $163,800 | $59,400 | $104,400 |
| 2017 | $2,712 | $156,700 | $59,400 | $97,300 |
| 2016 | $2,594 | $153,400 | $59,400 | $94,000 |
| 2015 | $2,857 | $162,900 | $59,400 | $103,500 |
| 2014 | $1,429 | $162,900 | $59,400 | $103,500 |
Map
- 115 Saratoga Ave
- 115 Bonneville Ave
- 44 White St
- 21 Luther St
- 2 Marion St
- 216 Springfield St
- 123 Grape St
- 40 Marion St
- 54 Casino Ave
- 20 Athol St
- 250 School St
- 75 Wheatland Ave
- 85 Farnsworth St
- 35 Lower Grape St
- 265 Wheatland Ave
- 1258 Liberty St
- 156 South St
- 115 Connecticut Ave
- 78 Marble Ave
- 582 Broadway St
Ask me questions while you tour the home.