48 Gorham Ave Pembroke, MA 02359
Estimated Value: $488,000 - $559,000
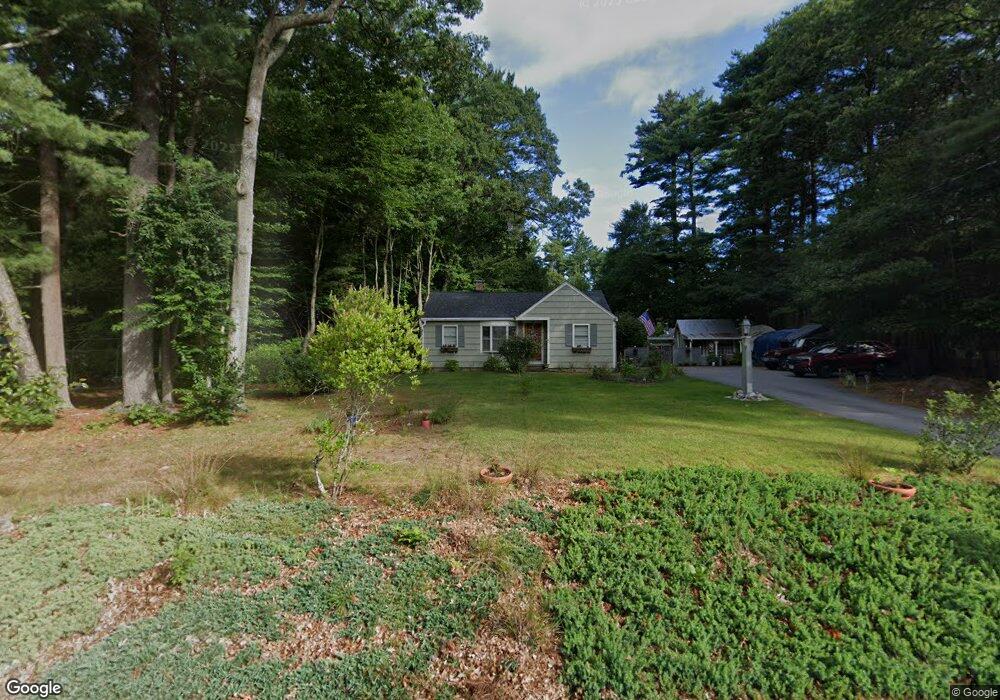
About This Home
This home is located at 48 Gorham Ave, Pembroke, MA 02359 and is currently estimated at $520,197, approximately $523 per square foot. 48 Gorham Ave is a home located in Plymouth County with nearby schools including Pembroke High School.
Ownership History
We collect this data history from publicly available records. To have your information removed, we recommend requesting removal directly through your county’s website.
Purchase Details
Purchase Details
Home Financials for this Owner
Home Financials are based on the most recent Mortgage that was taken out on this home.Purchase Details
Purchase History
We collect this data history from publicly available records. To have your information removed, we recommend requesting removal directly through your county’s website.
| Date | Buyer | Sale Price | Title Company |
|---|---|---|---|
| -- | -- | ||
| $198,500 | -- | ||
| $129,000 | -- |
Mortgage History
We collect this data history from publicly available records. To have your information removed, we recommend requesting removal directly through your county’s website.
| Date | Status | Borrower | Loan Amount |
|---|---|---|---|
| Previous Owner | $142,300 | ||
| Previous Owner | $150,000 | ||
| Previous Owner | $34,500 |
Tax History
We collect this data history from publicly available records. To have your information removed, we recommend requesting removal directly through your county’s website.
| Year | Tax Paid | Tax Assessment Tax Assessment Total Assessment is a certain percentage of the fair market value that is determined by local assessors to be the total taxable value of land and additions on the property. | Land | Improvement |
|---|---|---|---|---|
| 2025 | $5,279 | $439,200 | $265,300 | $173,900 |
| 2024 | $5,101 | $424,000 | $251,100 | $172,900 |
| 2023 | $5,236 | $411,600 | $251,100 | $160,500 |
| 2022 | $4,716 | $333,300 | $205,500 | $127,800 |
| 2021 | $4,416 | $302,900 | $196,000 | $106,900 |
| 2020 | $4,262 | $294,100 | $187,200 | $106,900 |
| 2019 | $4,123 | $282,400 | $182,500 | $99,900 |
| 2018 | $3,772 | $253,300 | $165,700 | $87,600 |
| 2017 | $3,690 | $244,400 | $156,800 | $87,600 |
| 2016 | $3,592 | $235,400 | $147,800 | $87,600 |
| 2015 | $3,269 | $221,800 | $134,200 | $87,600 |
Map
- 552 Mattakeesett St
- 158 Bay State Cir
- 17 E Boundary Rd
- 47 Woodbine Ave
- 17 Woodbine Ave
- 10 Beach Rd
- 77 Furnace Ln
- 5 Pine Cir
- 0 Monponsett St
- 610 Center St
- 42 Taylor Point Rd
- 241 Indian Head St
- 467 South St
- 468 South St
- 66 Mill St
- 556 Monponsett St
- 102 Ransom Rd
- 254 Lakeside Rd
- 24 Meadow Ln
- 243 Maquan St
Ask me questions while you tour the home.