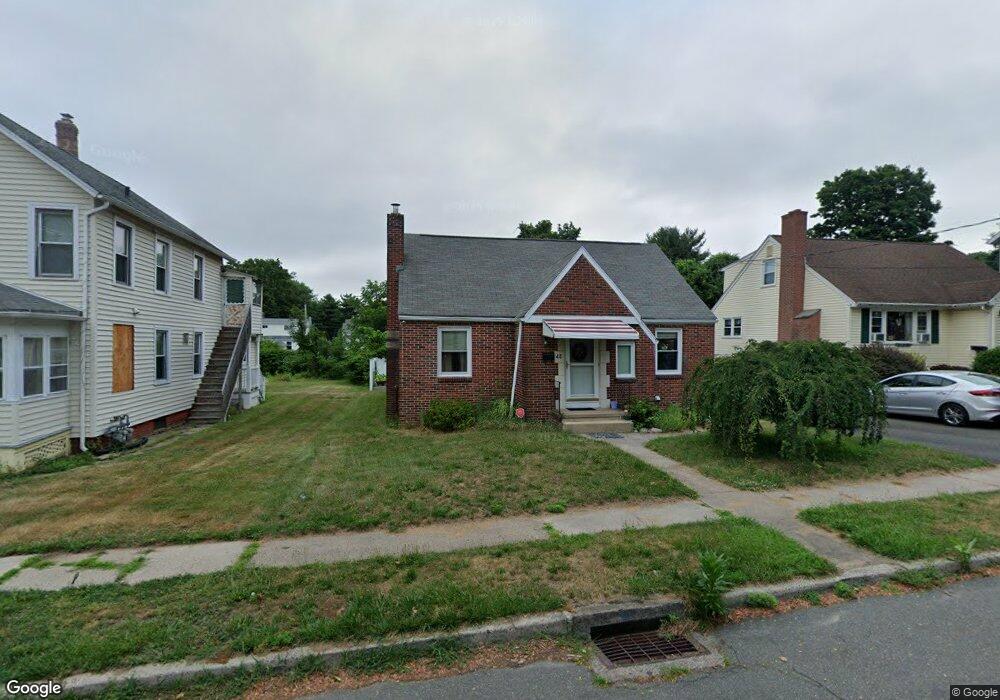
48 High St Wallingford, CT 06492
Estimated Value: $365,985 - $439,000
3
Beds
1
Bath
1,678
Sq Ft
$231/Sq Ft
Est. Value
About This Home
This home is located at 48 High St, Wallingford, CT 06492 and is currently estimated at $387,996, approximately $231 per square foot. 48 High St is a home located in New Haven County with nearby schools including Moses Y Beach Elementary School, Rock Hill Elementary School, and Dag Hammarskjold Middle School.
Ownership History
Date
Name
Owned For
Owner Type
Purchase Details
Closed on
Jul 2, 2004
Sold by
Barberino Lena P
Bought by
Hall Michael
Current Estimated Value
Home Financials for this Owner
Home Financials are based on the most recent Mortgage that was taken out on this home.
Original Mortgage
$90,000
Outstanding Balance
$45,198
Interest Rate
6.3%
Estimated Equity
$342,798
Create a Home Valuation Report for This Property
The Home Valuation Report is an in-depth analysis detailing your home's value as well as a comparison with similar homes in the area
Home Values in the Area
Average Home Value in this Area
Purchase History
| Date | Buyer | Sale Price | Title Company |
|---|---|---|---|
| Hall Michael | $110,000 | -- | |
| Hall Michael | $110,000 | -- |
Source: Public Records
Mortgage History
| Date | Status | Borrower | Loan Amount |
|---|---|---|---|
| Open | Hall Michael | $90,000 | |
| Closed | Hall Michael | $90,000 |
Source: Public Records
Tax History
| Year | Tax Paid | Tax Assessment Tax Assessment Total Assessment is a certain percentage of the fair market value that is determined by local assessors to be the total taxable value of land and additions on the property. | Land | Improvement |
|---|---|---|---|---|
| 2025 | $5,461 | $226,400 | $74,800 | $151,600 |
| 2024 | $4,685 | $152,800 | $62,400 | $90,400 |
| 2023 | $4,483 | $152,800 | $62,400 | $90,400 |
| 2022 | $4,437 | $152,800 | $62,400 | $90,400 |
| 2021 | $4,358 | $152,800 | $62,400 | $90,400 |
| 2020 | $4,326 | $148,200 | $66,600 | $81,600 |
| 2019 | $4,326 | $148,200 | $66,600 | $81,600 |
| 2018 | $4,244 | $148,200 | $66,600 | $81,600 |
| 2017 | $4,231 | $148,200 | $66,600 | $81,600 |
| 2016 | $4,133 | $148,200 | $66,600 | $81,600 |
| 2015 | $4,162 | $151,500 | $66,700 | $84,800 |
| 2014 | $4,074 | $151,500 | $66,700 | $84,800 |
Source: Public Records
Map
Nearby Homes
- 108 N Whittlesey Ave
- 85 N Colony St
- 570 N Main St
- 71 Cedar Ln
- 42 S Cherry St Unit 238
- 42 S Cherry St Unit 307
- 54 Claremont Ave
- 46 S Cherry St Unit 245
- 39 Farm Hill Rd
- 120 S Cherry St
- 90 Masonic Ave
- 30 Clinton Place
- 17 Olde Village Cir Unit 17
- 319 S Main St
- 1 Dean Dr
- 147 Constitution St
- 134 E Main St
- 17 Evergreene Unit 17
- 31 S Turnpike Rd Unit C2
- 28 Fairview Ave
Your Personal Tour Guide
Ask me questions while you tour the home.