48 Lee St Unit 50 Stoneham, MA 02180
Lindenwood NeighborhoodEstimated Value: $1,138,000 - $1,336,000
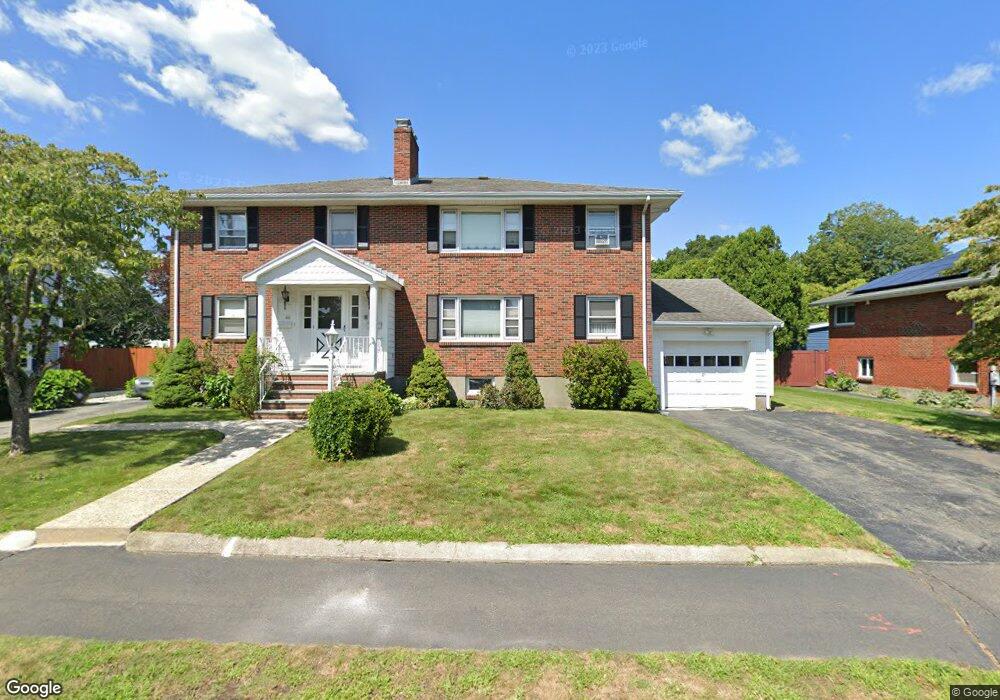
About This Home
This home is located at 48 Lee St Unit 50, Stoneham, MA 02180 and is currently estimated at $1,241,043, approximately $293 per square foot. 48 Lee St Unit 50 is a home located in Middlesex County with nearby schools including Stoneham High School and St. Patrick Elementary School.
Ownership History
We collect this data history from publicly available records. To have your information removed, we recommend requesting removal directly through your county’s website.
Purchase Details
Home Financials for this Owner
Home Financials are based on the most recent Mortgage that was taken out on this home.Home Values in the Area
Average Home Value in this Area
Purchase History
We collect this data history from publicly available records. To have your information removed, we recommend requesting removal directly through your county’s website.
| Date | Buyer | Sale Price | Title Company |
|---|---|---|---|
| $1,250,000 | -- |
Mortgage History
We collect this data history from publicly available records. To have your information removed, we recommend requesting removal directly through your county’s website.
| Date | Status | Borrower | Loan Amount |
|---|---|---|---|
| Open | $1,032,650 |
Tax History
We collect this data history from publicly available records. To have your information removed, we recommend requesting removal directly through your county’s website.
| Year | Tax Paid | Tax Assessment Tax Assessment Total Assessment is a certain percentage of the fair market value that is determined by local assessors to be the total taxable value of land and additions on the property. | Land | Improvement |
|---|---|---|---|---|
| 2025 | $9,993 | $976,800 | $400,100 | $576,700 |
| 2024 | $10,101 | $953,800 | $370,100 | $583,700 |
| 2023 | $10,254 | $923,800 | $340,100 | $583,700 |
| 2022 | $9,276 | $891,100 | $320,100 | $571,000 |
| 2021 | $9,170 | $847,500 | $300,100 | $547,400 |
| 2020 | $8,833 | $818,600 | $300,100 | $518,500 |
| 2019 | $8,073 | $719,500 | $270,100 | $449,400 |
| 2018 | $8,135 | $694,700 | $250,100 | $444,600 |
| 2017 | $7,574 | $611,300 | $240,100 | $371,200 |
| 2016 | $7,525 | $592,500 | $240,100 | $352,400 |
| 2015 | $7,558 | $583,200 | $240,100 | $343,100 |
| 2014 | $7,290 | $540,400 | $220,100 | $320,300 |
Map
- 10 Magnolia Terrace
- 63 Oak St
- 5 Elizabeth Rd
- 120 North St
- 34 Oak St
- 380 Salem St
- 5 Concord Rd
- 1 Toms Way
- 2 O'Connor Ln
- 159 Main St Unit 11C
- 159 Main St Unit 49A
- 159 Main St Unit 54A
- 66 Main St Unit 26A
- 66 Main St Unit 11A
- 1 Albert Dr Unit 8
- 64 Main St Unit 45B
- 64 Main St Unit 21B
- 57 Augustus Ct Unit 4006
- 40 Main St Unit 205
- 15 George St
Ask me questions while you tour the home.