48 Maple St Canfield, OH 44406
Canfield AreaEstimated Value: $176,477 - $210,000
About This Home
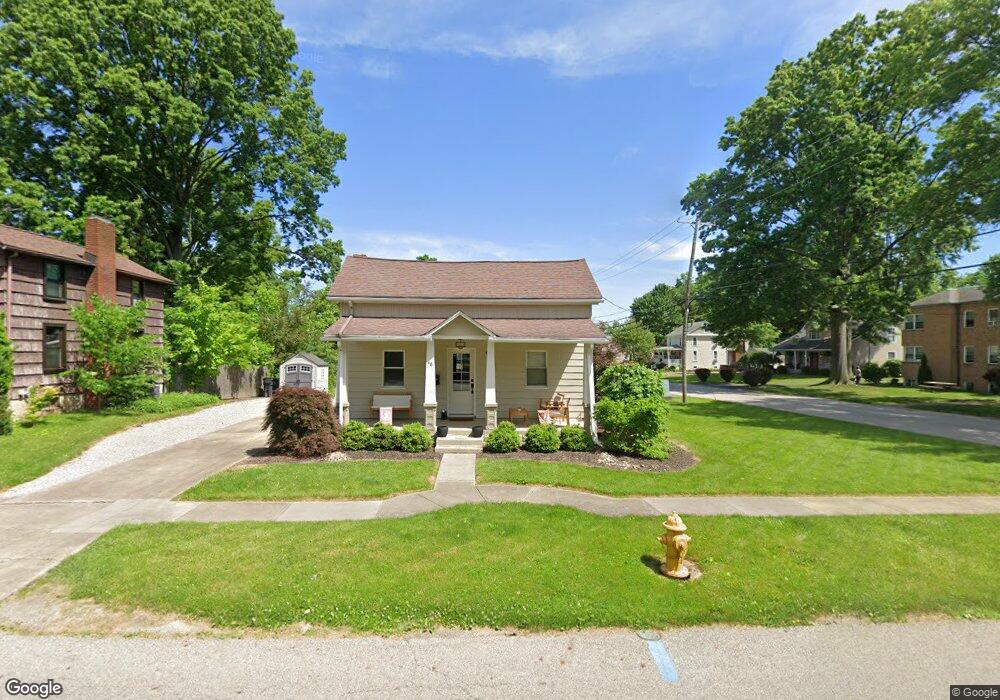
This home is located at 48 Maple St, Canfield, OH 44406 and is currently estimated at $196,369, approximately $162 per square foot. 48 Maple St is a home located in Mahoning County with nearby schools including Canfield Village Middle School and Canfield High School.
Ownership History
We collect this data history from publicly available records. To have your information removed, we recommend requesting removal directly through your county’s website.
Purchase Details
Purchase Details
Home Financials for this Owner
Home Financials are based on the most recent Mortgage that was taken out on this home.Purchase Details
Home Values in the Area
Average Home Value in this Area
Purchase History
We collect this data history from publicly available records. To have your information removed, we recommend requesting removal directly through your county’s website.
| Date | Buyer | Sale Price | Title Company |
|---|---|---|---|
| $45,000 | None Available | ||
| $53,500 | -- | ||
| -- | -- |
Mortgage History
We collect this data history from publicly available records. To have your information removed, we recommend requesting removal directly through your county’s website.
| Date | Status | Borrower | Loan Amount |
|---|---|---|---|
| Open | $100,000 | ||
| Closed | $37,500 | ||
| Previous Owner | $50,825 |
Tax History
We collect this data history from publicly available records. To have your information removed, we recommend requesting removal directly through your county’s website.
| Year | Tax Paid | Tax Assessment Tax Assessment Total Assessment is a certain percentage of the fair market value that is determined by local assessors to be the total taxable value of land and additions on the property. | Land | Improvement |
|---|---|---|---|---|
| 2025 | $1,882 | $42,750 | $5,990 | $36,760 |
| 2024 | $1,882 | $42,750 | $5,990 | $36,760 |
| 2023 | $1,853 | $42,750 | $5,990 | $36,760 |
| 2022 | $966 | $17,720 | $5,680 | $12,040 |
| 2021 | $938 | $17,720 | $5,680 | $12,040 |
| 2020 | $942 | $17,720 | $5,680 | $12,040 |
| 2019 | $847 | $14,410 | $5,680 | $8,730 |
| 2018 | $837 | $14,410 | $5,680 | $8,730 |
| 2017 | $879 | $14,410 | $5,680 | $8,730 |
| 2016 | $924 | $16,260 | $5,680 | $10,580 |
| 2015 | $905 | $16,260 | $5,680 | $10,580 |
| 2014 | $909 | $16,260 | $5,680 | $10,580 |
| 2013 | $877 | $16,260 | $5,680 | $10,580 |
Map
- 223 Fairview Ave
- 231 S Broad St
- 115 Queens Ln
- 104 Court St
- 145 Village Blvd
- 30 Barnstone Ln Unit 18
- 185 Queens Ln
- 125 Callahan Rd
- 124 Wadsworth St
- 153 Callahan Rd
- 196 N Broad St
- 74 Skyline Dr
- 50 Stratford Green Dr Unit 4
- 999 Timbercrest Dr
- 170 Chapel Ln
- 220 Montgomery Dr
- 170 Oak Tree Dr
- 74 Oak Tree Dr
- 17 Willow Way
- 61 Villa Theresa Ln
Ask me questions while you tour the home.