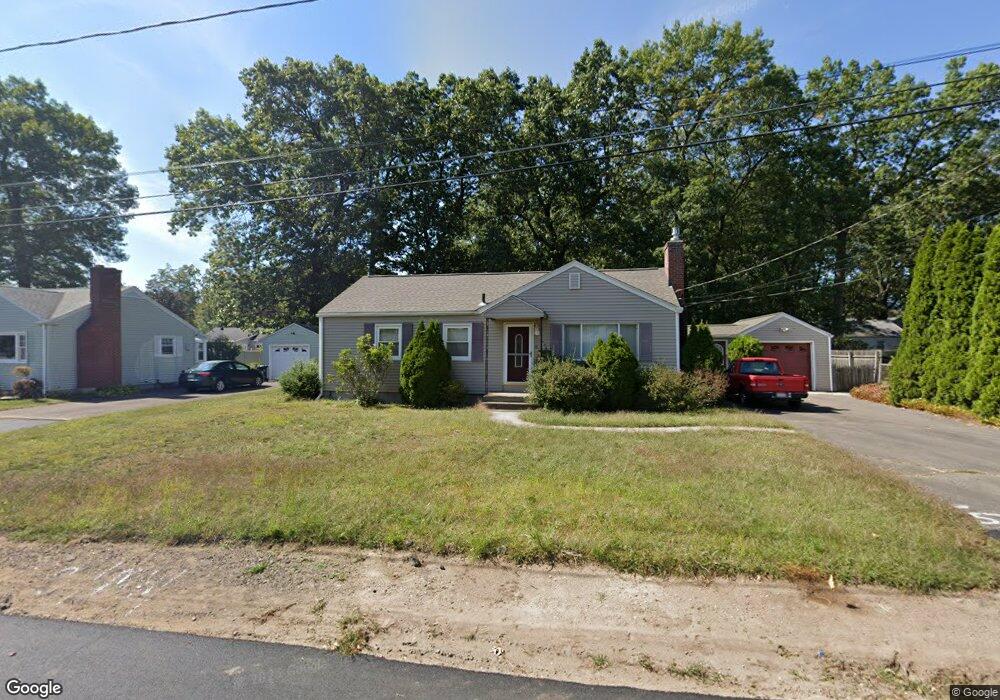
48 May St Chicopee, MA 01020
Fairview NeighborhoodEstimated Value: $313,725 - $358,000
3
Beds
1
Bath
1,068
Sq Ft
$315/Sq Ft
Est. Value
About This Home
This home is located at 48 May St, Chicopee, MA 01020 and is currently estimated at $336,681, approximately $315 per square foot. 48 May St is a home located in Hampden County with nearby schools including Streiber Elementary School, Fairview Middle School, and Chicopee Comprehensive High School.
Ownership History
Date
Name
Owned For
Owner Type
Purchase Details
Closed on
Aug 2, 2004
Sold by
Edwards Collin C
Bought by
Edwards Claudine M
Current Estimated Value
Purchase Details
Closed on
Dec 15, 1998
Sold by
Luippold Jan M
Bought by
Edwards Collin C and Edwards Claudine M
Home Financials for this Owner
Home Financials are based on the most recent Mortgage that was taken out on this home.
Original Mortgage
$117,198
Interest Rate
6.8%
Mortgage Type
Purchase Money Mortgage
Purchase Details
Closed on
Sep 30, 1988
Sold by
Luippold Erwin J
Bought by
Gilliand William J
Create a Home Valuation Report for This Property
The Home Valuation Report is an in-depth analysis detailing your home's value as well as a comparison with similar homes in the area
Home Values in the Area
Average Home Value in this Area
Purchase History
| Date | Buyer | Sale Price | Title Company |
|---|---|---|---|
| Edwards Claudine M | -- | -- | |
| Edwards Collin C | $114,900 | -- | |
| Gilliand William J | $112,000 | -- |
Source: Public Records
Mortgage History
| Date | Status | Borrower | Loan Amount |
|---|---|---|---|
| Open | Gilliand William J | $136,000 | |
| Closed | Gilliand William J | $25,000 | |
| Previous Owner | Gilliand William J | $117,198 |
Source: Public Records
Tax History
| Year | Tax Paid | Tax Assessment Tax Assessment Total Assessment is a certain percentage of the fair market value that is determined by local assessors to be the total taxable value of land and additions on the property. | Land | Improvement |
|---|---|---|---|---|
| 2025 | $3,919 | $258,500 | $100,400 | $158,100 |
| 2024 | $3,720 | $252,000 | $98,400 | $153,600 |
| 2023 | $3,459 | $228,300 | $89,500 | $138,800 |
| 2022 | $3,311 | $194,900 | $77,800 | $117,100 |
| 2021 | $3,209 | $182,200 | $70,700 | $111,500 |
| 2020 | $3,092 | $177,100 | $72,700 | $104,400 |
| 2019 | $3,055 | $170,100 | $72,700 | $97,400 |
| 2018 | $2,955 | $161,400 | $69,200 | $92,200 |
| 2017 | $2,801 | $161,800 | $65,300 | $96,500 |
| 2016 | $2,751 | $162,700 | $65,300 | $97,400 |
| 2015 | $2,747 | $156,600 | $65,300 | $91,300 |
| 2014 | $1,373 | $156,600 | $65,300 | $91,300 |
Source: Public Records
Map
Nearby Homes
Your Personal Tour Guide
Ask me questions while you tour the home.