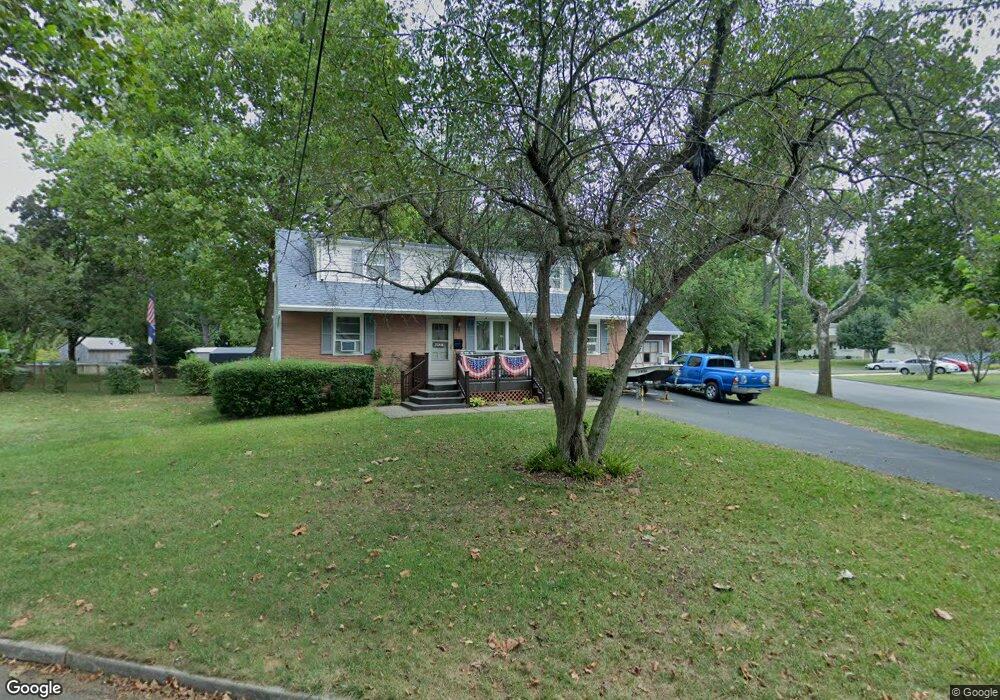
48 Mimi Rd Old Bridge, NJ 08857
Estimated Value: $472,000 - $535,737
Studio
--
Bath
1,676
Sq Ft
$309/Sq Ft
Est. Value
About This Home
This home is located at 48 Mimi Rd, Old Bridge, NJ 08857 and is currently estimated at $517,434, approximately $308 per square foot. 48 Mimi Rd is a home located in Middlesex County with nearby schools including Old Bridge High School, St. Thomas the Apostle School, and Immaculate Conception School.
Ownership History
Date
Name
Owned For
Owner Type
Purchase Details
Closed on
Jan 7, 2023
Sold by
Gonzalez Sinecio and Gonzalez Carmen
Bought by
Gambino Joseph Vincent and Gambino Rosario
Current Estimated Value
Home Financials for this Owner
Home Financials are based on the most recent Mortgage that was taken out on this home.
Original Mortgage
$330,000
Outstanding Balance
$319,588
Interest Rate
6.49%
Mortgage Type
New Conventional
Estimated Equity
$197,846
Purchase Details
Closed on
Feb 10, 1986
Bought by
Gonzalez Sinecio and Gonzalez Carmen
Create a Home Valuation Report for This Property
The Home Valuation Report is an in-depth analysis detailing your home's value as well as a comparison with similar homes in the area
Home Values in the Area
Average Home Value in this Area
Purchase History
| Date | Buyer | Sale Price | Title Company |
|---|---|---|---|
| Gambino Joseph Vincent | $380,000 | Centurion Title Services | |
| Gonzalez Sinecio | $108,000 | -- |
Source: Public Records
Mortgage History
| Date | Status | Borrower | Loan Amount |
|---|---|---|---|
| Open | Gambino Joseph Vincent | $330,000 |
Source: Public Records
Tax History
| Year | Tax Paid | Tax Assessment Tax Assessment Total Assessment is a certain percentage of the fair market value that is determined by local assessors to be the total taxable value of land and additions on the property. | Land | Improvement |
|---|---|---|---|---|
| 2025 | $8,177 | $144,800 | $52,000 | $92,800 |
| 2024 | $7,594 | $144,800 | $52,000 | $92,800 |
| 2023 | $7,594 | $144,800 | $52,000 | $92,800 |
| 2022 | $7,414 | $144,800 | $52,000 | $92,800 |
| 2021 | $5,438 | $144,800 | $52,000 | $92,800 |
| 2020 | $7,188 | $144,800 | $52,000 | $92,800 |
| 2019 | $7,312 | $144,800 | $52,000 | $92,800 |
| 2018 | $6,981 | $144,800 | $52,000 | $92,800 |
| 2017 | $6,747 | $144,800 | $52,000 | $92,800 |
| 2016 | $6,852 | $144,800 | $52,000 | $92,800 |
| 2015 | $6,733 | $144,800 | $52,000 | $92,800 |
| 2014 | $6,665 | $144,800 | $52,000 | $92,800 |
Source: Public Records
Map
Nearby Homes
- 1299 Englishtown Rd
- 14 Brookside Ave
- 5 Dan Ct
- 35 Birch St
- 34 Brookside Ave
- 30 Arvin Rd
- 41 Brookside Dr Ave
- 41 Brookside Ave
- 1212 Englishtown Rd
- 1210 Englishtown Rd
- 46 Emily Dr
- 21 Pine St
- 98 Madison Ave
- 82 Madison Ave
- 268 Austin Ave
- 14 Andover Rd
- 315 Herbert Ave
- 296 Herbert Ave
- 24 Kensington Ave
- 1800 New Jersey 18
Your Personal Tour Guide
Ask me questions while you tour the home.