Estimated Value: $273,000 - $313,000
3
Beds
2
Baths
1,390
Sq Ft
$207/Sq Ft
Est. Value
About This Home
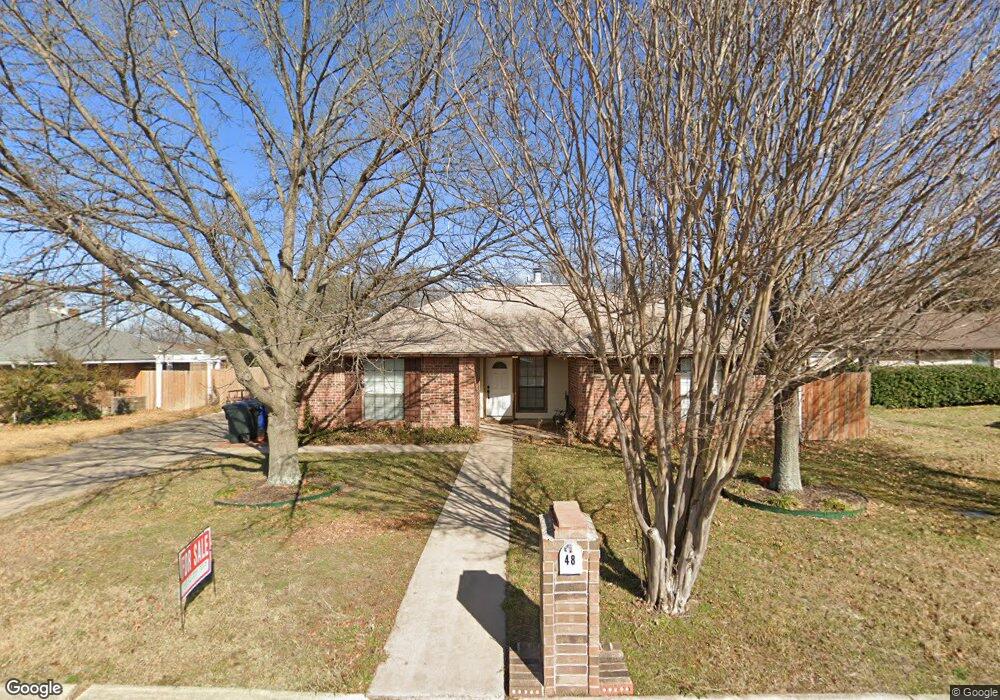
This home is located at 48 N Sharon Dr, Krum, TX 76249 and is currently estimated at $288,056, approximately $207 per square foot. 48 N Sharon Dr is a home located in Denton County with nearby schools including Krum Early Education Center, Blanche Dodd Intermediate School, and Krum Middle School.
Ownership History
Date
Name
Owned For
Owner Type
Purchase Details
Closed on
Jun 7, 2021
Sold by
Lynch Donna Raquel
Bought by
Fernandez Fernando and Rincon Irene
Current Estimated Value
Home Financials for this Owner
Home Financials are based on the most recent Mortgage that was taken out on this home.
Original Mortgage
$220,924
Outstanding Balance
$200,019
Interest Rate
2.9%
Mortgage Type
FHA
Estimated Equity
$88,037
Create a Home Valuation Report for This Property
The Home Valuation Report is an in-depth analysis detailing your home's value as well as a comparison with similar homes in the area
Home Values in the Area
Average Home Value in this Area
Purchase History
We collect this data history from publicly available records. To have your information removed, we recommend requesting removal directly through your county’s website.
| Date | Buyer | Sale Price | Title Company |
|---|---|---|---|
| Fernandez Fernando | -- | First American Title |
Source: Public Records
Mortgage History
We collect this data history from publicly available records. To have your information removed, we recommend requesting removal directly through your county’s website.
| Date | Status | Borrower | Loan Amount |
|---|---|---|---|
| Open | Fernandez Fernando | $220,924 |
Source: Public Records
Tax History
| Year | Tax Paid | Tax Assessment Tax Assessment Total Assessment is a certain percentage of the fair market value that is determined by local assessors to be the total taxable value of land and additions on the property. | Land | Improvement |
|---|---|---|---|---|
| 2025 | $4,403 | $263,000 | $72,000 | $191,000 |
| 2024 | $5,643 | $280,000 | $72,000 | $208,000 |
| 2023 | $4,412 | $280,000 | $67,770 | $212,230 |
| 2022 | $5,889 | $256,738 | $58,500 | $198,238 |
| 2021 | $4,335 | $195,466 | $36,000 | $159,466 |
| 2020 | $4,288 | $189,357 | $36,000 | $153,357 |
| 2019 | $4,399 | $182,300 | $36,000 | $146,300 |
| 2018 | $3,891 | $160,432 | $36,000 | $124,432 |
| 2017 | $3,784 | $155,340 | $29,250 | $126,090 |
| 2016 | $3,312 | $135,947 | $29,250 | $106,697 |
| 2015 | $2,959 | $120,774 | $29,250 | $91,524 |
| 2013 | -- | $105,067 | $29,250 | $75,817 |
Source: Public Records
Map
Nearby Homes
- 7272 Christina Ct
- 7257 Christina Ct
- 209 Mourning Dove Ln
- 107 N 7th St
- 209 W Huffman St
- 101 N 7th St
- 1 Finley Cir
- tbdd Farm To Market Road 1173
- TBD 50 Acres Farm To Market Road 1173
- 342 W Huffman St
- 304 Woodlawn St
- 417 W Huffman St
- 17972 Farm To Market Road 1173
- 201 N 3rd St
- 426 W Lake St
- TBD Hopkins Rd
- 331 Radecke Rd
- 31 Rogers Cir
- 421 S 1st St
- 124 Fm 2450
Your Personal Tour Guide
Ask me questions while you tour the home.