48 Park St Fall River, MA 02721
Corky Row NeighborhoodEstimated Value: $335,000 - $361,000
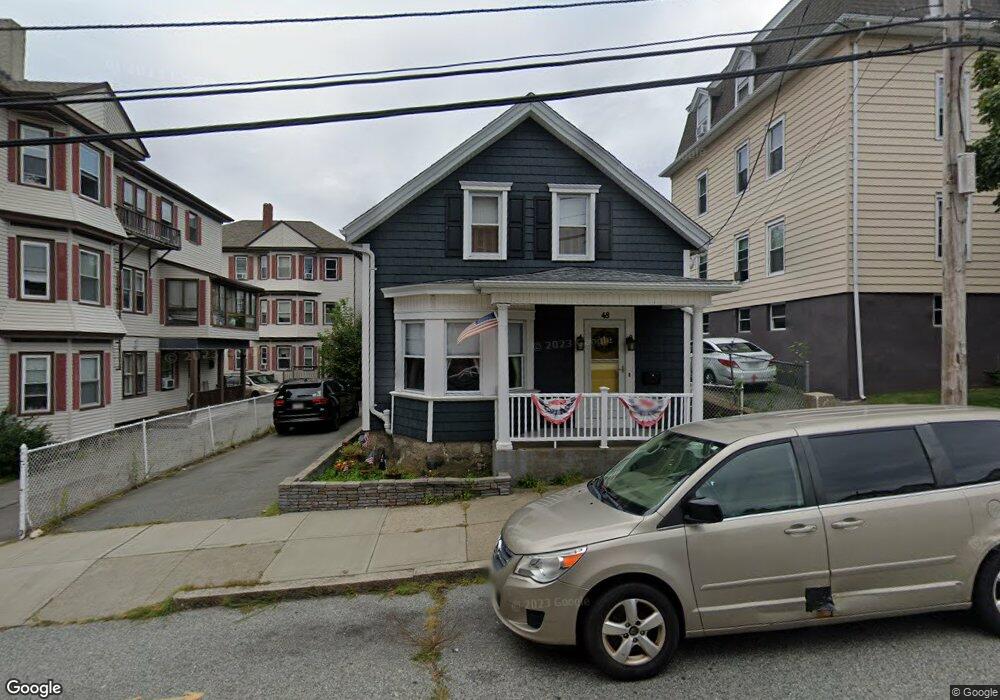
About This Home
This home is located at 48 Park St, Fall River, MA 02721 and is currently estimated at $347,051, approximately $248 per square foot. 48 Park St is a home located in Bristol County with nearby schools including Henry Lord Community School, B M C Durfee High School, and Argosy Collegiate Charter School.
Ownership History
We collect this data history from publicly available records. To have your information removed, we recommend requesting removal directly through your county’s website.
Purchase Details
Home Values in the Area
Average Home Value in this Area
Purchase History
We collect this data history from publicly available records. To have your information removed, we recommend requesting removal directly through your county’s website.
| Date | Buyer | Sale Price | Title Company |
|---|---|---|---|
| $165,000 | -- |
Mortgage History
We collect this data history from publicly available records. To have your information removed, we recommend requesting removal directly through your county’s website.
| Date | Status | Borrower | Loan Amount |
|---|---|---|---|
| Open | $138,000 | ||
| Closed | $146,000 |
Tax History
We collect this data history from publicly available records. To have your information removed, we recommend requesting removal directly through your county’s website.
| Year | Tax Paid | Tax Assessment Tax Assessment Total Assessment is a certain percentage of the fair market value that is determined by local assessors to be the total taxable value of land and additions on the property. | Land | Improvement |
|---|---|---|---|---|
| 2025 | $3,179 | $277,600 | $105,200 | $172,400 |
| 2024 | $2,995 | $260,700 | $101,300 | $159,400 |
| 2023 | $2,764 | $225,300 | $83,700 | $141,600 |
| 2022 | $2,585 | $204,800 | $79,700 | $125,100 |
| 2021 | $2,416 | $174,700 | $75,800 | $98,900 |
| 2020 | $2,448 | $169,400 | $74,700 | $94,700 |
| 2019 | $2,352 | $161,300 | $72,000 | $89,300 |
| 2018 | $2,259 | $154,500 | $77,900 | $76,600 |
| 2017 | $2,101 | $150,100 | $74,300 | $75,800 |
| 2016 | $2,055 | $150,800 | $79,100 | $71,700 |
| 2015 | $1,972 | $150,800 | $79,100 | $71,700 |
| 2014 | $1,867 | $148,400 | $76,700 | $71,700 |
Map
- 34-36 Park St
- 58 Forest St
- 280 Ridge St
- 165 Grant St
- 517 S Main St
- 169 Grant St
- 155 Grant St
- 998 Middle St
- 334 Fountain St
- 340 Fountain St
- 311-315 Mulberry St
- 423 Division St
- 425 Division St
- 700 2nd St Unit 110
- 403 Division St Unit 17
- 403 Division St Unit 16
- 403 Division St Unit 11
- 403 Division St Unit 5
- 403 Division St Unit 4
- 403 Division St Unit 1
- 40 Park St Unit 2
- 40 Park St Unit 1
- 40 Park St Unit 3
- 58-60 Park St Unit 3
- 81 Forest St
- 81 Forest St Unit 3
- 73 Forest St
- 73 Forest St Unit 2
- 20 Park St
- 78 Park St
- 55 Forest St
- 55 Forest St Unit 1
- 720 S Main St
- 92 Park St
- 64 Forest St
- 64 Forest St Unit 2
- 64 Forest St Unit 3
- 64 Forest St Unit 1
- 74 Forest St
- 74 Forest St Unit 2
Ask me questions while you tour the home.