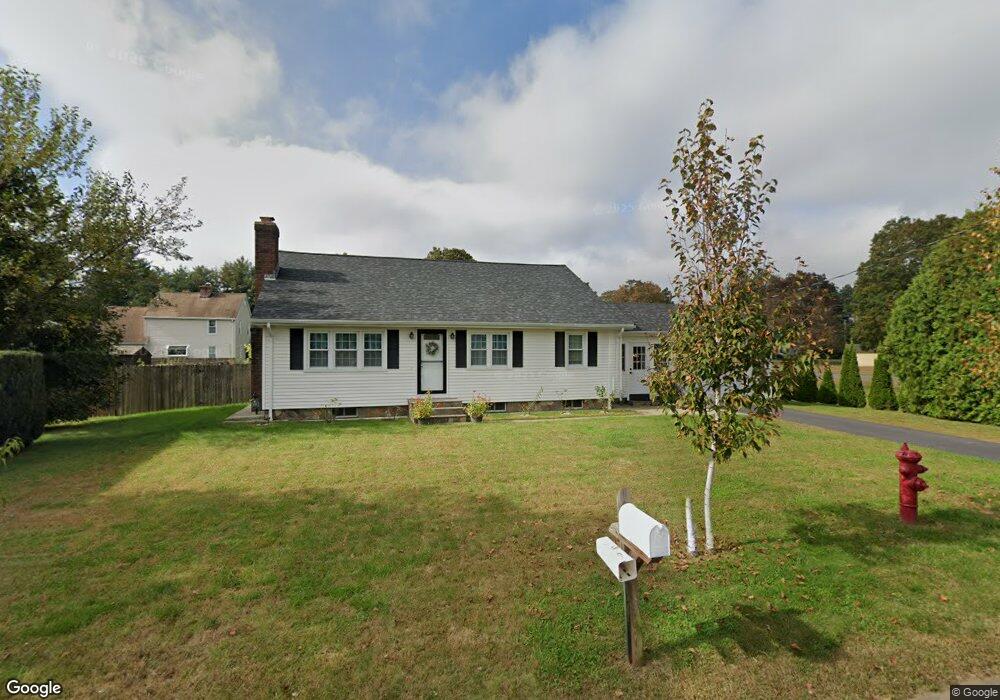
48 Queen St Westfield, MA 01085
Estimated Value: $320,054 - $387,000
3
Beds
1
Bath
1,287
Sq Ft
$266/Sq Ft
Est. Value
About This Home
This home is located at 48 Queen St, Westfield, MA 01085 and is currently estimated at $342,514, approximately $266 per square foot. 48 Queen St is a home located in Hampden County with nearby schools including Westfield High School and Saint Mary High School.
Ownership History
Date
Name
Owned For
Owner Type
Purchase Details
Closed on
Oct 7, 2010
Sold by
Taber Mary Ann
Bought by
Grusetchi Vasile and Grusetchi Larisa I
Current Estimated Value
Home Financials for this Owner
Home Financials are based on the most recent Mortgage that was taken out on this home.
Original Mortgage
$176,595
Outstanding Balance
$116,653
Interest Rate
4.37%
Mortgage Type
FHA
Estimated Equity
$225,861
Create a Home Valuation Report for This Property
The Home Valuation Report is an in-depth analysis detailing your home's value as well as a comparison with similar homes in the area
Home Values in the Area
Average Home Value in this Area
Purchase History
| Date | Buyer | Sale Price | Title Company |
|---|---|---|---|
| Grusetchi Vasile | $183,000 | -- |
Source: Public Records
Mortgage History
| Date | Status | Borrower | Loan Amount |
|---|---|---|---|
| Open | Grusetchi Vasile | $176,595 |
Source: Public Records
Tax History
| Year | Tax Paid | Tax Assessment Tax Assessment Total Assessment is a certain percentage of the fair market value that is determined by local assessors to be the total taxable value of land and additions on the property. | Land | Improvement |
|---|---|---|---|---|
| 2025 | $4,311 | $284,000 | $97,400 | $186,600 |
| 2024 | $4,395 | $275,200 | $88,600 | $186,600 |
| 2023 | $3,951 | $247,500 | $84,400 | $163,100 |
| 2022 | $3,951 | $213,700 | $75,300 | $138,400 |
| 2021 | $3,825 | $202,600 | $71,000 | $131,600 |
| 2020 | $3,702 | $192,300 | $71,000 | $121,300 |
| 2019 | $3,613 | $183,700 | $67,600 | $116,100 |
| 2018 | $3,556 | $183,700 | $67,600 | $116,100 |
| 2017 | $3,488 | $179,600 | $68,600 | $111,000 |
| 2016 | $3,491 | $179,600 | $68,600 | $111,000 |
| 2015 | $3,330 | $179,600 | $68,600 | $111,000 |
| 2014 | $2,489 | $179,600 | $68,600 | $111,000 |
Source: Public Records
Map
Nearby Homes
- 13 Furrow St
- 105 Montgomery St
- 9 Montgomery St
- 0 Lockhouse Rd Unit 73496193
- Lot 5 Montgomery
- 19 Arch Rd
- 88 Woodmont St
- 3 Belmont St
- 4 Belmont St
- 212 Montgomery Rd
- 19 Kellogg St
- 97 Mechanic St
- 5 Day Lily Ln
- 100 Meadow St
- 42R Jefferson St
- 32 Allen Ave
- 7 Washington St
- 357 Southampton Rd
- 40 Hawks Cir
- 30 Deepwoods Dr
Your Personal Tour Guide
Ask me questions while you tour the home.