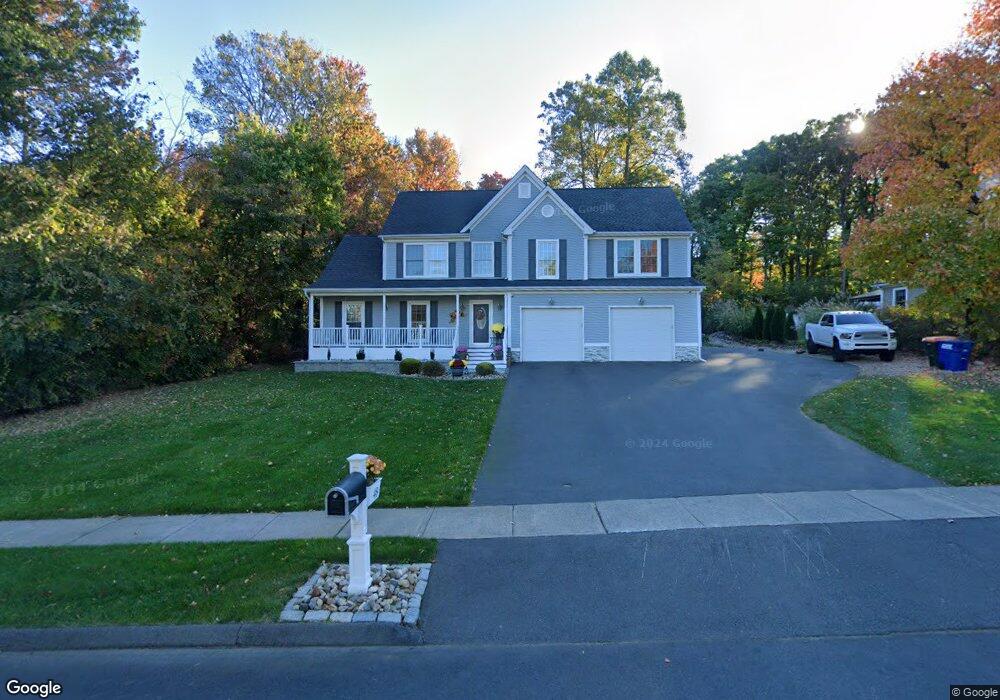
48 Russet Ln Southington, CT 06489
West Southington NeighborhoodEstimated Value: $543,000 - $612,000
4
Beds
3
Baths
1,956
Sq Ft
$291/Sq Ft
Est. Value
About This Home
This home is located at 48 Russet Ln, Southington, CT 06489 and is currently estimated at $568,731, approximately $290 per square foot. 48 Russet Ln is a home located in Hartford County with nearby schools including Urbin T. Kelley Elementary School, Joseph A. Depaolo Middle School, and Southington High School.
Ownership History
Date
Name
Owned For
Owner Type
Purchase Details
Closed on
May 6, 2005
Sold by
Griffin 4Th William J and Griffin Valerie J
Bought by
Szlejter John and Szlejter Dorota
Current Estimated Value
Home Financials for this Owner
Home Financials are based on the most recent Mortgage that was taken out on this home.
Original Mortgage
$200,000
Interest Rate
6.01%
Purchase Details
Closed on
Aug 1, 2003
Sold by
Fishbein Christopher and Fishbein June
Bought by
Griffin Willaim J and Griffin Valerie J
Purchase Details
Closed on
Dec 16, 1998
Sold by
The Carriers Llc
Bought by
Fishbein Christopher and Fishbein Jane
Create a Home Valuation Report for This Property
The Home Valuation Report is an in-depth analysis detailing your home's value as well as a comparison with similar homes in the area
Home Values in the Area
Average Home Value in this Area
Purchase History
| Date | Buyer | Sale Price | Title Company |
|---|---|---|---|
| Szlejter John | $310,000 | -- | |
| Griffin Willaim J | $274,900 | -- | |
| Fishbein Christopher | $175,246 | -- |
Source: Public Records
Mortgage History
| Date | Status | Borrower | Loan Amount |
|---|---|---|---|
| Open | Fishbein Christopher | $108,000 | |
| Open | Fishbein Christopher | $241,000 | |
| Closed | Fishbein Christopher | $185,000 | |
| Closed | Fishbein Christopher | $200,000 |
Source: Public Records
Tax History
| Year | Tax Paid | Tax Assessment Tax Assessment Total Assessment is a certain percentage of the fair market value that is determined by local assessors to be the total taxable value of land and additions on the property. | Land | Improvement |
|---|---|---|---|---|
| 2025 | $7,671 | $230,980 | $71,380 | $159,600 |
| 2024 | $7,262 | $230,980 | $71,380 | $159,600 |
| 2023 | $7,013 | $230,980 | $71,380 | $159,600 |
| 2022 | $6,728 | $230,980 | $71,380 | $159,600 |
| 2021 | $6,705 | $230,980 | $71,380 | $159,600 |
| 2020 | $6,823 | $222,770 | $72,840 | $149,930 |
| 2019 | $6,826 | $222,770 | $72,840 | $149,930 |
| 2018 | $6,790 | $222,770 | $72,840 | $149,930 |
| 2017 | $6,790 | $222,770 | $72,840 | $149,930 |
| 2016 | $6,603 | $222,770 | $72,840 | $149,930 |
| 2015 | $5,968 | $204,790 | $63,590 | $141,200 |
| 2014 | $5,808 | $204,790 | $63,590 | $141,200 |
Source: Public Records
Map
Nearby Homes
- 24 Vicki Ln
- 309 Russet Ln
- 141 Little Fawn Rd
- 500 Mill St Unit 8
- 83 Little Fawn Rd
- 22 Garden Gate Rd
- 46 John St
- 119 Bishop Ave
- 485 West St
- 77 Howard Ave
- 147 Winchester Dr
- 0 Winchester Estates Lot 17
- 1384 West St
- 207 Lazy Ln Unit 9
- 207 Lazy Ln Unit 2
- 207 Lazy Ln Unit 1
- 207 Lazy Ln Unit 6
- 207 Lazy Ln Unit 12
- 207 Lazy Ln Unit 11
- 207 Lazy Ln Unit 4
Your Personal Tour Guide
Ask me questions while you tour the home.