48 Sagamore Ave Quincy, MA 02171
Montclair NeighborhoodEstimated Value: $574,000 - $702,000
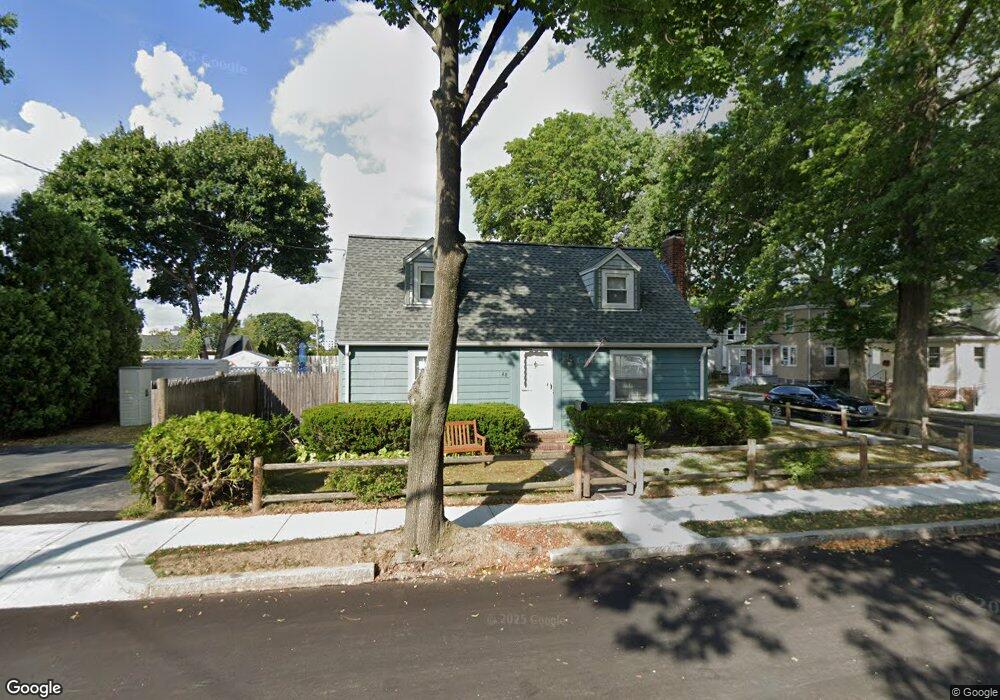
About This Home
This home is located at 48 Sagamore Ave, Quincy, MA 02171 and is currently estimated at $617,328, approximately $671 per square foot. 48 Sagamore Ave is a home located in Norfolk County with nearby schools including Montclair Elementary School, Atlantic Middle School, and North Quincy High School.
Ownership History
We collect this data history from publicly available records. To have your information removed, we recommend requesting removal directly through your county’s website.
Purchase Details
Home Values in the Area
Average Home Value in this Area
Purchase History
We collect this data history from publicly available records. To have your information removed, we recommend requesting removal directly through your county’s website.
| Date | Buyer | Sale Price | Title Company |
|---|---|---|---|
| $143,500 | -- |
Mortgage History
We collect this data history from publicly available records. To have your information removed, we recommend requesting removal directly through your county’s website.
| Date | Status | Borrower | Loan Amount |
|---|---|---|---|
| Closed | $213,000 | ||
| Closed | $65,000 | ||
| Closed | $255,000 | ||
| Closed | $100,000 | ||
| Closed | $85,000 |
Tax History
We collect this data history from publicly available records. To have your information removed, we recommend requesting removal directly through your county’s website.
| Year | Tax Paid | Tax Assessment Tax Assessment Total Assessment is a certain percentage of the fair market value that is determined by local assessors to be the total taxable value of land and additions on the property. | Land | Improvement |
|---|---|---|---|---|
| 2025 | $5,905 | $512,100 | $315,600 | $196,500 |
| 2024 | $5,857 | $519,700 | $315,600 | $204,100 |
| 2023 | $5,468 | $491,300 | $300,600 | $190,700 |
| 2022 | $5,244 | $437,700 | $261,400 | $176,300 |
| 2021 | $5,083 | $418,700 | $248,900 | $169,800 |
| 2020 | $5,027 | $404,400 | $248,900 | $155,500 |
| 2019 | $4,638 | $369,600 | $232,600 | $137,000 |
| 2018 | $4,632 | $347,200 | $215,400 | $131,800 |
| 2017 | $4,492 | $317,000 | $205,100 | $111,900 |
| 2016 | $4,084 | $284,400 | $178,400 | $106,000 |
| 2015 | $3,856 | $264,100 | $162,200 | $101,900 |
| 2014 | $3,578 | $240,800 | $154,400 | $86,400 |
Map
- 89 Ardell St
- 115 W Squantum St Unit 803
- 185 Hamilton Ave
- 54 Alvin Ave
- 120 Holmes St Unit 304
- 210 Newbury Ave Unit 2L
- 260 Newbury Ave
- 99 Newbury Ave
- 94 Newbury Ave Unit 100
- 133 Commander Shea Blvd Unit 712
- 133 Commander Shea Blvd Unit 505
- 133 Commander Shea Blvd Unit 504
- 133 Commander Shea Blvd Unit 817
- 245 Newport Ave
- 267-269 Farrington St
- 251 Newport Ave
- 10 Weston Ave Unit 112
- 41 Buckingham Rd
- 90 Quincy Shore Dr Unit 805
- 90 Quincy Shore Dr Unit 302
- 9 Sterling St
- 44 Sagamore Ave
- 5 Sterling St
- 43 Sagamore Ave
- 21 Sterling St Unit 21
- 19 Sterling St
- 37 Sagamore Ave
- 40 Sagamore Ave
- 14 Sterling St
- 37 Montclair Ave
- 1 Sterling St
- 10 Sterling St
- 6 Sterling St
- 33 Montclair Ave
- 2 Sterling St
- 60 Sagamore Ave
- 20 Sterling St
- 20 Sterling St Unit 2
- 52 Ardell St
- 35 Sagamore Ave
Ask me questions while you tour the home.