48 Spring St Metuchen, NJ 08840
Estimated Value: $925,600 - $1,112,000
About This Home
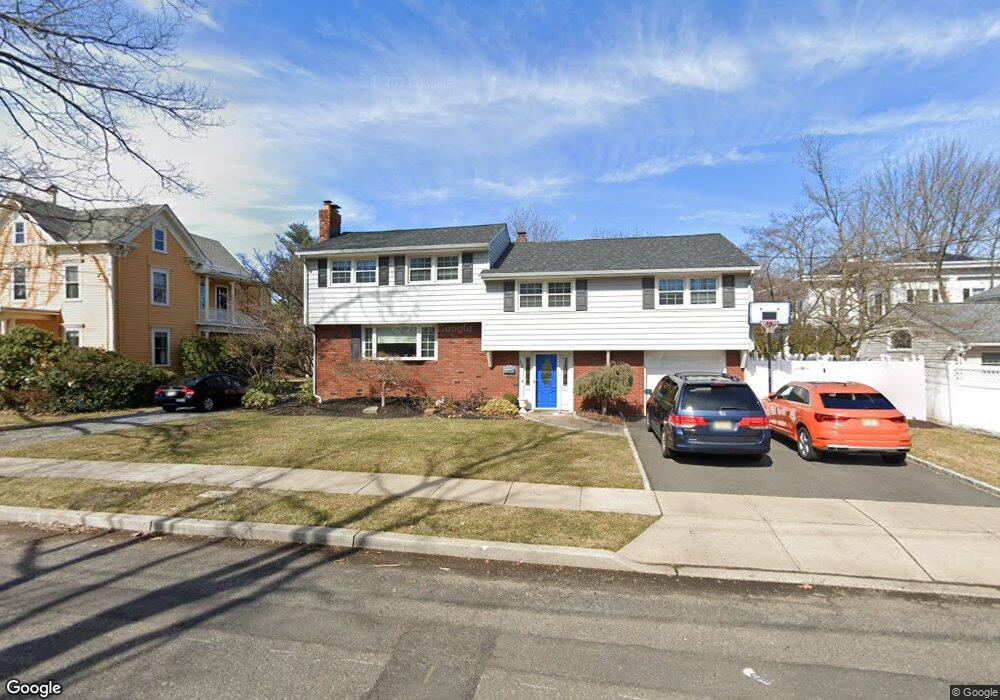
This home is located at 48 Spring St, Metuchen, NJ 08840 and is currently estimated at $998,650, approximately $521 per square foot. 48 Spring St is a home located in Middlesex County with nearby schools including Edgar Middle School, Campbell Elementary School, and Metuchen High School.
Ownership History
We collect this data history from publicly available records. To have your information removed, we recommend requesting removal directly through your county’s website.
Purchase Details
Home Financials for this Owner
Home Financials are based on the most recent Mortgage that was taken out on this home.Purchase Details
Home Financials for this Owner
Home Financials are based on the most recent Mortgage that was taken out on this home.Purchase Details
Home Financials for this Owner
Home Financials are based on the most recent Mortgage that was taken out on this home.Purchase Details
Home Financials for this Owner
Home Financials are based on the most recent Mortgage that was taken out on this home.Purchase Details
Home Financials for this Owner
Home Financials are based on the most recent Mortgage that was taken out on this home.Home Values in the Area
Average Home Value in this Area
Purchase History
We collect this data history from publicly available records. To have your information removed, we recommend requesting removal directly through your county’s website.
| Date | Buyer | Sale Price | Title Company |
|---|---|---|---|
| -- | Title Trust Llc | ||
| -- | Netco Title | ||
| $665,000 | -- | ||
| $270,000 | -- | ||
| $231,000 | -- |
Mortgage History
We collect this data history from publicly available records. To have your information removed, we recommend requesting removal directly through your county’s website.
| Date | Status | Borrower | Loan Amount |
|---|---|---|---|
| Open | $337,000 | ||
| Closed | $350,000 | ||
| Closed | $417,000 | ||
| Previous Owner | $256,500 | ||
| Previous Owner | $185,000 |
Tax History
We collect this data history from publicly available records. To have your information removed, we recommend requesting removal directly through your county’s website.
| Year | Tax Paid | Tax Assessment Tax Assessment Total Assessment is a certain percentage of the fair market value that is determined by local assessors to be the total taxable value of land and additions on the property. | Land | Improvement |
|---|---|---|---|---|
| 2025 | $15,440 | $222,000 | $102,000 | $120,000 |
| 2024 | $14,923 | $222,000 | $102,000 | $120,000 |
| 2023 | $14,923 | $222,000 | $102,000 | $120,000 |
| 2022 | $14,144 | $222,000 | $102,000 | $120,000 |
| 2021 | $10,304 | $222,000 | $102,000 | $120,000 |
| 2020 | $13,637 | $222,000 | $102,000 | $120,000 |
| 2019 | $13,236 | $222,000 | $102,000 | $120,000 |
| 2018 | $13,187 | $222,000 | $102,000 | $120,000 |
| 2017 | $13,044 | $220,300 | $101,800 | $118,500 |
| 2016 | $12,711 | $220,300 | $101,800 | $118,500 |
| 2015 | $12,429 | $220,300 | $101,800 | $118,500 |
| 2014 | $12,119 | $220,300 | $101,800 | $118,500 |
Map
- 52 Spring St
- 21 Thomas St
- 0 Cliffwood Place
- 4 Honey Ct
- 19 Clinton Place
- 78 Rose St
- 197B Amboy Ave
- 197A Amboy Ave
- 26 Charles St
- 21 Bounty St
- 180 Amboy Ave
- 7 Myrtle Ave
- 32 Sheridan Ave
- 25 Voorhees Place
- 41 Lake Ave
- 32 Robins Place
- 230 Woodbridge Ave
- 149 Rose St Unit 301E
- 49 Kentnor St
- 59 Franklin School Way
Ask me questions while you tour the home.