48 Tyler St Lawrence, MA 01843
South West NeighborhoodEstimated Value: $592,188 - $790,000
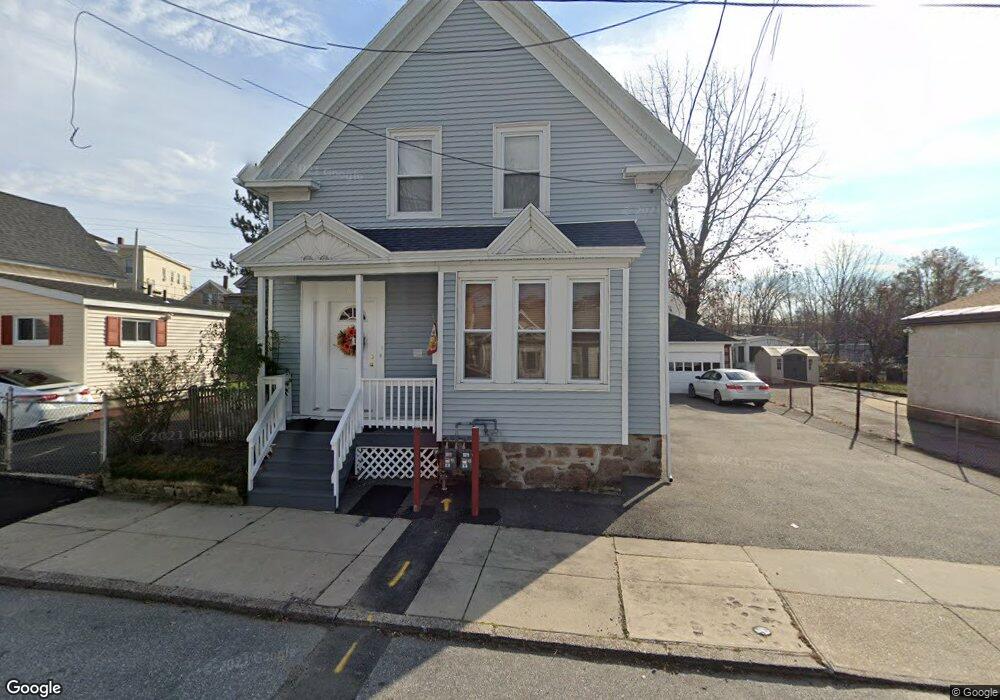
About This Home
This home is located at 48 Tyler St, Lawrence, MA 01843 and is currently estimated at $712,797, approximately $398 per square foot. 48 Tyler St is a home located in Essex County with nearby schools including John Breen School, Emily G. Wetherbee School (K-8), and School For Exceptional Studies.
Ownership History
We collect this data history from publicly available records. To have your information removed, we recommend requesting removal directly through your county’s website.
Purchase Details
Home Values in the Area
Average Home Value in this Area
Purchase History
We collect this data history from publicly available records. To have your information removed, we recommend requesting removal directly through your county’s website.
| Date | Buyer | Sale Price | Title Company |
|---|---|---|---|
| $12,000 | -- |
Mortgage History
We collect this data history from publicly available records. To have your information removed, we recommend requesting removal directly through your county’s website.
| Date | Status | Borrower | Loan Amount |
|---|---|---|---|
| Open | $75,000 | ||
| Closed | $50,000 |
Tax History
We collect this data history from publicly available records. To have your information removed, we recommend requesting removal directly through your county’s website.
| Year | Tax Paid | Tax Assessment Tax Assessment Total Assessment is a certain percentage of the fair market value that is determined by local assessors to be the total taxable value of land and additions on the property. | Land | Improvement |
|---|---|---|---|---|
| 2025 | $4,721 | $536,500 | $98,200 | $438,300 |
| 2024 | $4,621 | $499,600 | $106,200 | $393,400 |
| 2023 | $4,501 | $443,000 | $98,500 | $344,500 |
| 2022 | $4,194 | $366,600 | $89,300 | $277,300 |
| 2021 | $4,106 | $334,600 | $89,300 | $245,300 |
| 2020 | $3,951 | $317,900 | $84,700 | $233,200 |
| 2019 | $4,044 | $295,600 | $70,300 | $225,300 |
| 2018 | $3,712 | $259,200 | $66,600 | $192,600 |
| 2017 | $3,455 | $225,200 | $62,900 | $162,300 |
| 2016 | $3,378 | $217,800 | $51,800 | $166,000 |
| 2015 | $3,314 | $219,200 | $51,800 | $167,400 |
Map
- 14 Tyler St Unit 1
- 301 Salem St
- 18-20 Everett St
- 86 S Broadway
- 110-112 Everett St
- 82 S Broadway
- 199-205 Boxford St
- 33 Garfield St
- 46 S Bowdoin St
- 2 Andover Terrace
- 263-265 Water St
- 267-269 Water St
- 66-68 Water St
- 134-136 Boxford St
- 18 Hancock St
- 401 S Broadway
- 5 Lafayette Ave
- 115 Beacon Ave Unit A
- 36 Louisberg St
- 159 S Union St
- 52 Tyler St
- 96 Newton St
- 21 Border St Unit 23
- 21-23 Border St
- 98 Newton St
- 42 Tyler St
- 13 Border St
- 86 Newton St Unit 1
- 86 Newton St
- 105 Newton St
- 102 Newton St
- 36 Tyler St Unit 38
- 45 Tyler St
- 38 Tyler St
- 39 Tyler St Unit 41
- 91 Newton St Unit 93
- 18 Border St Unit 18
- 20 Border St
- 106 Newton St
- 16 Border St Unit 16
Ask me questions while you tour the home.