480 E 500 N Logan, UT 84321
Adams NeighborhoodEstimated Value: $356,000 - $418,000
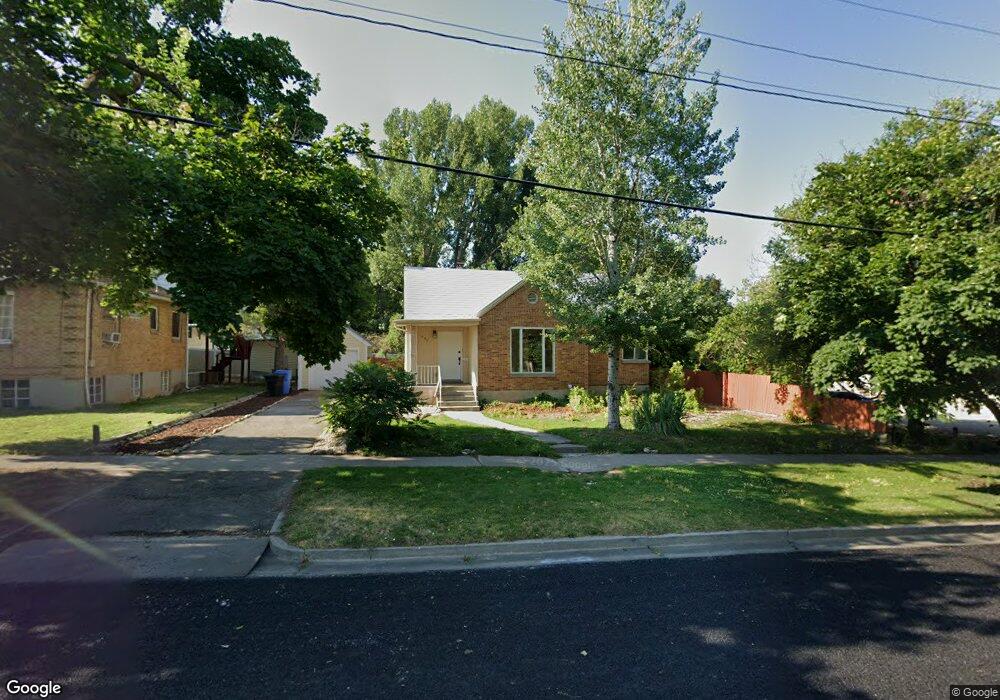
About This Home
Enjoy this refreshed classic brick home close to Utah State University
with private yard and 1 car garage. Lots of natural light and plenty of windows.
This rambler is newly painted with an updated kitchen as well as
refinished hardwood oak flooring, new carpeting, and travertine tile.
This spacious 4 bedroom, 2 bathroom home has approximately 2000 sf and
has central A/C with W/D hookups as well as a yard with deck.
The convenient location is across from Adams park and elementary school
situated on a free bus route and close to shopping.
Renters pay utilities: Logan City and gas.
No smoking/vaping on the property.
No pets but may be negotiable.
Renters insurance required.
Application fee: $30/first adult plus $10/additional adult.
Lease initiation fee: $100
Background screening required before processing application.
Ownership History
We collect this data history from publicly available records. To have your information removed, we recommend requesting removal directly through your county’s website.
Purchase Details
Home Financials for this Owner
Home Financials are based on the most recent Mortgage that was taken out on this home.Purchase Details
Home Financials for this Owner
Home Financials are based on the most recent Mortgage that was taken out on this home.Purchase Details
Purchase Details
Home Financials for this Owner
Home Financials are based on the most recent Mortgage that was taken out on this home.Purchase Details
Purchase Details
Home Financials for this Owner
Home Financials are based on the most recent Mortgage that was taken out on this home.Purchase Details
Home Financials for this Owner
Home Financials are based on the most recent Mortgage that was taken out on this home.Purchase Details
Home Financials for this Owner
Home Financials are based on the most recent Mortgage that was taken out on this home.Home Values in the Area
Average Home Value in this Area
Purchase History
We collect this data history from publicly available records. To have your information removed, we recommend requesting removal directly through your county’s website.
| Date | Buyer | Sale Price | Title Company |
|---|---|---|---|
| -- | None Listed On Document | ||
| -- | Northern Title | ||
| -- | Northern Title Company | ||
| -- | Cache Title Company | ||
| -- | Cache Title Company | ||
| -- | None Available | ||
| -- | Hickman Land Title Company | ||
| -- | Cache Title Company | ||
| -- | American Secure Title |
Mortgage History
We collect this data history from publicly available records. To have your information removed, we recommend requesting removal directly through your county’s website.
| Date | Status | Borrower | Loan Amount |
|---|---|---|---|
| Open | $300,750 | ||
| Previous Owner | $113,250 | ||
| Previous Owner | $113,600 | ||
| Previous Owner | $137,738 | ||
| Previous Owner | $99,950 |
Property History
We collect this data history from publicly available records. To have your information removed, we recommend requesting removal directly through your county’s website.
| Date | Event | Price | List to Sale | Price per Sq Ft |
|---|---|---|---|---|
| 11/01/2024 11/01/24 | Off Market | $2,200 | -- | -- |
| 10/08/2024 10/08/24 | Off Market | $2,200 | -- | -- |
| 10/02/2024 10/02/24 | For Rent | $2,200 | 0.0% | -- |
| 10/01/2024 10/01/24 | For Rent | $2,200 | -- | -- |
Tax History
We collect this data history from publicly available records. To have your information removed, we recommend requesting removal directly through your county’s website.
| Year | Tax Paid | Tax Assessment Tax Assessment Total Assessment is a certain percentage of the fair market value that is determined by local assessors to be the total taxable value of land and additions on the property. | Land | Improvement |
|---|---|---|---|---|
| 2025 | $1,693 | $219,005 | $0 | $0 |
| 2023 | $1,673 | $199,720 | $0 | $0 |
| 2022 | $1,785 | $199,020 | $0 | $0 |
| 2021 | $1,459 | $251,370 | $50,000 | $201,370 |
| 2020 | $1,322 | $204,900 | $50,000 | $154,900 |
| 2019 | $1,381 | $204,900 | $50,000 | $154,900 |
| 2018 | $1,167 | $158,080 | $50,000 | $108,080 |
| 2017 | $1,125 | $80,575 | $0 | $0 |
| 2016 | $1,167 | $76,175 | $0 | $0 |
| 2015 | $1,104 | $76,175 | $0 | $0 |
| 2014 | $998 | $76,175 | $0 | $0 |
| 2013 | -- | $73,990 | $0 | $0 |
Map
Ask me questions while you tour the home.