Estimated Value: $379,000 - $409,000
4
Beds
2
Baths
2,200
Sq Ft
$179/Sq Ft
Est. Value
About This Home
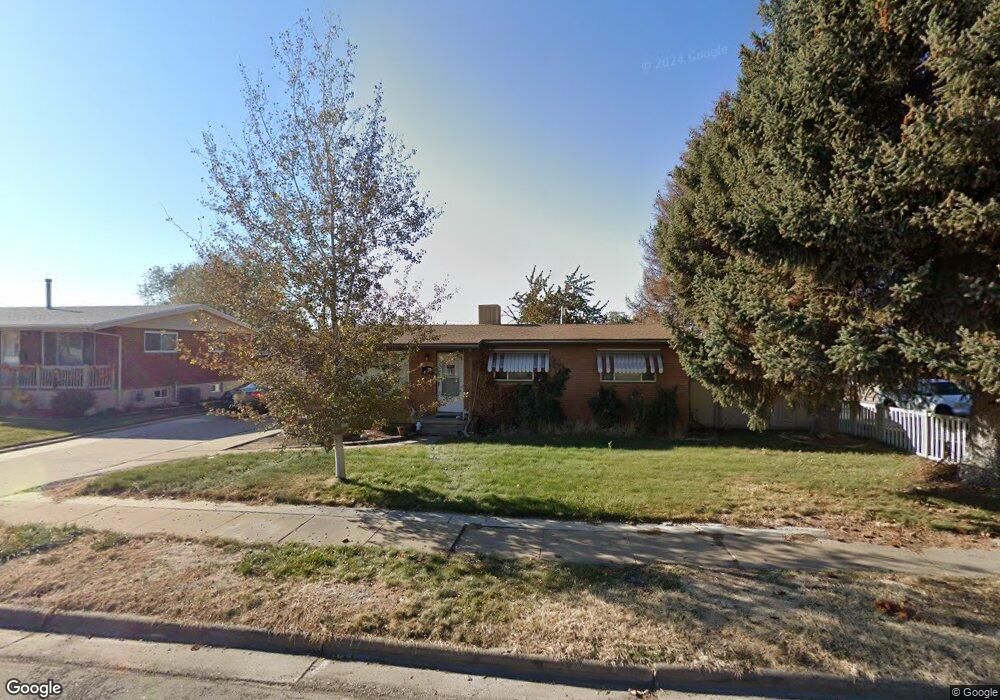
This home is located at 4805 S 2500 W, Roy, UT 84067 and is currently estimated at $393,880, approximately $179 per square foot. 4805 S 2500 W is a home located in Weber County with nearby schools including Lakeview Elementary School, Roy Junior High School, and Roy High School.
Ownership History
Date
Name
Owned For
Owner Type
Purchase Details
Closed on
Mar 15, 2010
Sold by
Bednarik Dennis Mark
Bought by
Bednarik Michelle Clay
Current Estimated Value
Purchase Details
Closed on
Apr 29, 1998
Sold by
Niederhauser Ronald M and Niederhauser Tammra
Bought by
Bednarik Dennis M and Bednarik Michelle C
Home Financials for this Owner
Home Financials are based on the most recent Mortgage that was taken out on this home.
Original Mortgage
$104,754
Outstanding Balance
$20,736
Interest Rate
7.25%
Mortgage Type
VA
Estimated Equity
$373,144
Create a Home Valuation Report for This Property
The Home Valuation Report is an in-depth analysis detailing your home's value as well as a comparison with similar homes in the area
Home Values in the Area
Average Home Value in this Area
Purchase History
We collect this data history from publicly available records. To have your information removed, we recommend requesting removal directly through your county’s website.
| Date | Buyer | Sale Price | Title Company |
|---|---|---|---|
| Bednarik Michelle Clay | -- | None Available | |
| Bednarik Dennis M | -- | Associated Title Company |
Source: Public Records
Mortgage History
We collect this data history from publicly available records. To have your information removed, we recommend requesting removal directly through your county’s website.
| Date | Status | Borrower | Loan Amount |
|---|---|---|---|
| Open | Bednarik Dennis M | $104,754 |
Source: Public Records
Tax History
| Year | Tax Paid | Tax Assessment Tax Assessment Total Assessment is a certain percentage of the fair market value that is determined by local assessors to be the total taxable value of land and additions on the property. | Land | Improvement |
|---|---|---|---|---|
| 2025 | $2,386 | $374,199 | $120,000 | $254,199 |
| 2024 | $2,330 | $202,399 | $66,000 | $136,399 |
| 2023 | $2,206 | $191,400 | $63,153 | $128,247 |
| 2022 | $2,352 | $211,750 | $55,002 | $156,748 |
| 2021 | $1,847 | $271,000 | $69,994 | $201,006 |
| 2020 | $1,775 | $240,000 | $69,994 | $170,006 |
| 2019 | $1,708 | $217,000 | $41,690 | $175,310 |
| 2018 | $1,559 | $185,000 | $37,626 | $147,374 |
| 2017 | $1,419 | $156,490 | $37,626 | $118,864 |
| 2016 | $1,344 | $79,391 | $18,970 | $60,421 |
| 2015 | $1,177 | $70,198 | $16,160 | $54,038 |
| 2014 | $1,181 | $69,760 | $16,160 | $53,600 |
Source: Public Records
Map
Nearby Homes
Your Personal Tour Guide
Ask me questions while you tour the home.