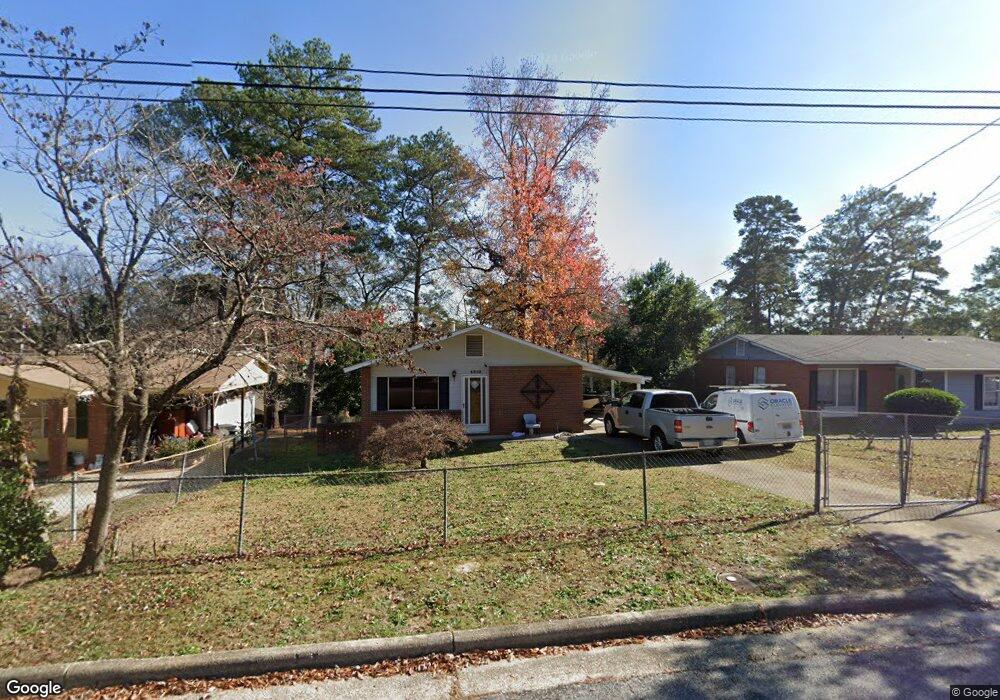
4810 19th Ave Columbus, GA 31904
North Columbus NeighborhoodEstimated Value: $121,000 - $146,000
About This Home
This home is located at 4810 19th Ave, Columbus, GA 31904 and is currently estimated at $132,012, approximately $126 per square foot. 4810 19th Ave is a home located in Muscogee County with nearby schools including Allen Elementary School, Arnold Middle School, and Jordan Vocational High School.
Ownership History
We collect this data history from publicly available records. To have your information removed, we recommend requesting removal directly through your county’s website.
Purchase Details
Home Financials for this Owner
Home Financials are based on the most recent Mortgage that was taken out on this home.Home Values in the Area
Average Home Value in this Area
Purchase History
We collect this data history from publicly available records. To have your information removed, we recommend requesting removal directly through your county’s website.
| Date | Buyer | Sale Price | Title Company |
|---|---|---|---|
| $69,900 | -- |
Mortgage History
We collect this data history from publicly available records. To have your information removed, we recommend requesting removal directly through your county’s website.
| Date | Status | Borrower | Loan Amount |
|---|---|---|---|
| Open | $65,374 | ||
| Closed | $5,000 |
Tax History
We collect this data history from publicly available records. To have your information removed, we recommend requesting removal directly through your county’s website.
| Year | Tax Paid | Tax Assessment Tax Assessment Total Assessment is a certain percentage of the fair market value that is determined by local assessors to be the total taxable value of land and additions on the property. | Land | Improvement |
|---|---|---|---|---|
| 2025 | $578 | $37,132 | $8,196 | $28,936 |
| 2024 | $577 | $37,132 | $8,196 | $28,936 |
| 2023 | $23 | $37,132 | $8,196 | $28,936 |
| 2022 | $602 | $29,836 | $8,196 | $21,640 |
| 2021 | $595 | $30,724 | $8,196 | $22,528 |
| 2020 | $595 | $30,724 | $8,196 | $22,528 |
| 2019 | $599 | $30,724 | $8,196 | $22,528 |
| 2018 | $599 | $30,724 | $8,196 | $22,528 |
| 2017 | $602 | $30,724 | $8,196 | $22,528 |
| 2016 | $606 | $27,961 | $2,902 | $25,059 |
| 2015 | $607 | $27,961 | $2,902 | $25,059 |
| 2014 | $609 | $27,961 | $2,902 | $25,059 |
| 2013 | -- | $20,367 | $2,902 | $17,465 |
Map
- 4814 20th Ave
- 4712 18th Ave
- 4830 17th Ave
- 1906 Coventry Dr
- 4909 Saint Francis Ave
- 4218 Lakewood Dr
- 2028 42nd St
- 1907 42nd St
- 5224 23rd Ave
- 4205 17th Ave
- 2023 41st St
- 2119 Lancaster Dr
- 4220 Saint Francis Ave
- 2325 Coventry Dr
- 1605 41st St
- 4344 Acacia Dr
- 2103 Terrace Dr
- 5106 11th Ave
- 4001 17th Ave
- 5118 11th Ave
Ask me questions while you tour the home.