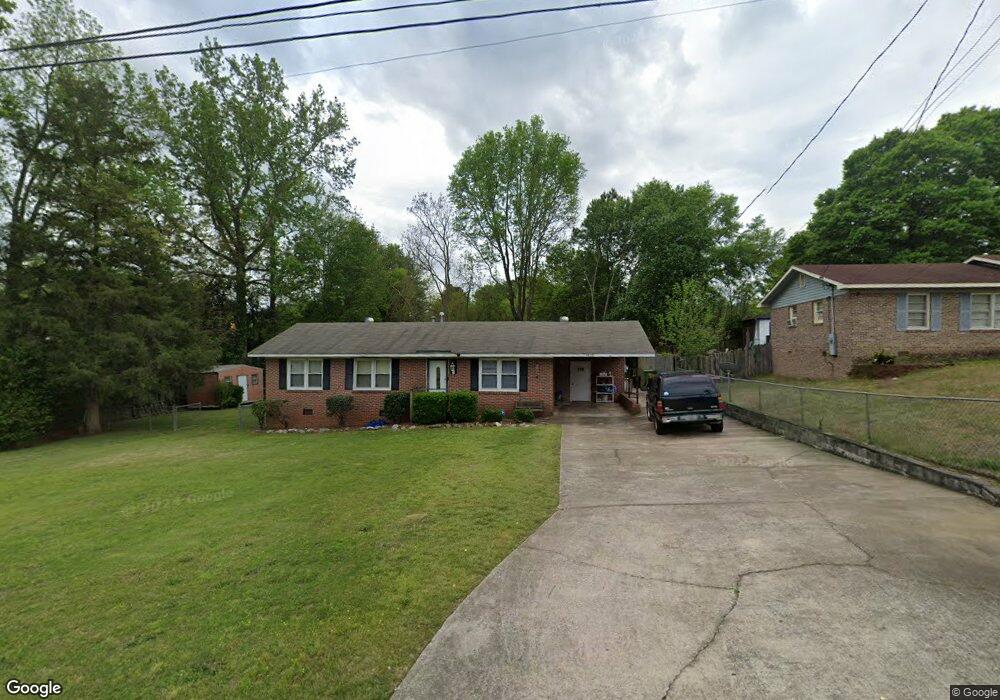
4828 Chapman St Columbus, GA 31907
East Columbus NeighborhoodEstimated Value: $119,000 - $179,000
3
Beds
2
Baths
1,435
Sq Ft
$96/Sq Ft
Est. Value
About This Home
This home is located at 4828 Chapman St, Columbus, GA 31907 and is currently estimated at $137,355, approximately $95 per square foot. 4828 Chapman St is a home located in Muscogee County with nearby schools including Lonnie Jackson Academy, Rothschild Leadership Academy, and Kendrick High School.
Ownership History
Date
Name
Owned For
Owner Type
Purchase Details
Closed on
Aug 8, 2012
Sold by
Wiggins Robert
Bought by
Purvis Russell L
Current Estimated Value
Purchase Details
Closed on
Oct 14, 2011
Sold by
Citimortgage Inc
Bought by
Sec Dept Of Housing & Urban
Purchase Details
Closed on
Oct 2, 2011
Sold by
Citimortgage Inc
Bought by
Citimortgage Inc
Purchase Details
Closed on
Jun 10, 2010
Sold by
Freeman Tamika Dixon
Bought by
Freeman Darrell E
Purchase Details
Closed on
May 14, 2007
Sold by
Freeman Darrell E
Bought by
Freeman Darrell E and Freeman Tamika Dixon
Home Financials for this Owner
Home Financials are based on the most recent Mortgage that was taken out on this home.
Original Mortgage
$102,393
Interest Rate
6.12%
Mortgage Type
FHA
Create a Home Valuation Report for This Property
The Home Valuation Report is an in-depth analysis detailing your home's value as well as a comparison with similar homes in the area
Home Values in the Area
Average Home Value in this Area
Purchase History
We collect this data history from publicly available records. To have your information removed, we recommend requesting removal directly through your county’s website.
| Date | Buyer | Sale Price | Title Company |
|---|---|---|---|
| Purvis Russell L | $36,500 | -- | |
| Wiggins Robert | $31,000 | -- | |
| Sec Dept Of Housing & Urban | $119,717 | -- | |
| Citimortgage Inc | $119,717 | -- | |
| Freeman Darrell E | -- | None Available | |
| Freeman Darrell E | -- | None Available | |
| Freeman Darrell E | $104,000 | None Available |
Source: Public Records
Mortgage History
We collect this data history from publicly available records. To have your information removed, we recommend requesting removal directly through your county’s website.
| Date | Status | Borrower | Loan Amount |
|---|---|---|---|
| Previous Owner | Freeman Darrell E | $102,393 |
Source: Public Records
Tax History
| Year | Tax Paid | Tax Assessment Tax Assessment Total Assessment is a certain percentage of the fair market value that is determined by local assessors to be the total taxable value of land and additions on the property. | Land | Improvement |
|---|---|---|---|---|
| 2025 | $1,423 | $36,364 | $6,532 | $29,832 |
| 2024 | $1,423 | $36,364 | $6,532 | $29,832 |
| 2023 | $1,432 | $36,364 | $6,532 | $29,832 |
| 2022 | $1,153 | $28,248 | $6,532 | $21,716 |
| 2021 | $1,197 | $29,316 | $6,532 | $22,784 |
| 2020 | $1,197 | $29,316 | $6,532 | $22,784 |
| 2019 | $1,201 | $29,316 | $6,532 | $22,784 |
| 2018 | $1,201 | $29,316 | $6,532 | $22,784 |
| 2017 | $1,205 | $29,316 | $6,532 | $22,784 |
| 2016 | $1,485 | $36,000 | $3,038 | $32,962 |
| 2015 | $1,487 | $36,000 | $3,038 | $32,962 |
| 2014 | $1,489 | $36,000 | $3,038 | $32,962 |
| 2013 | -- | $36,000 | $3,038 | $32,962 |
Source: Public Records
Map
Nearby Homes
- 763 Corley Dr
- 4804 Bruning St
- 644 Georgia Dr
- 632 Georgia Dr
- 815 Englewood Dr
- 821 Englewood Dr
- 616 Wright Dr
- 429 Steam Mill Place
- 4935 Buena Vista Rd
- 417 Wickham Dr
- 5235 Vincent Dr
- 5225 Buena Vista Rd
- 391 & 401 Victoria Dr
- 468 Bowen Blvd
- 4326 Empire St
- 410 McCartha Dr
- 4801 Allen St
- 5035 Gibbs Dr
- 1243 Aspen Ave
- 1354 Floyd Rd
- 4838 Chapman St
- 4844 Chapman St
- 4821 Atterbury Dr
- 4825 Atterbury Dr
- 4902 Chapman St
- 4817 Atterbury Dr
- 4841 Chapman St
- 4820 Chapman St
- 4901 Atterbury Dr
- 4831 Chapman St
- 4847 Chapman St
- 4813 Atterbury Dr
- 4908 Chapman St
- 4905 Atterbury Dr
- 4823 Chapman St
- 4814 Chapman St
- 4909 Chapman St
- 4809 Atterbury Dr
- 4838 Bruning St
- 4914 Chapman St
Your Personal Tour Guide
Ask me questions while you tour the home.