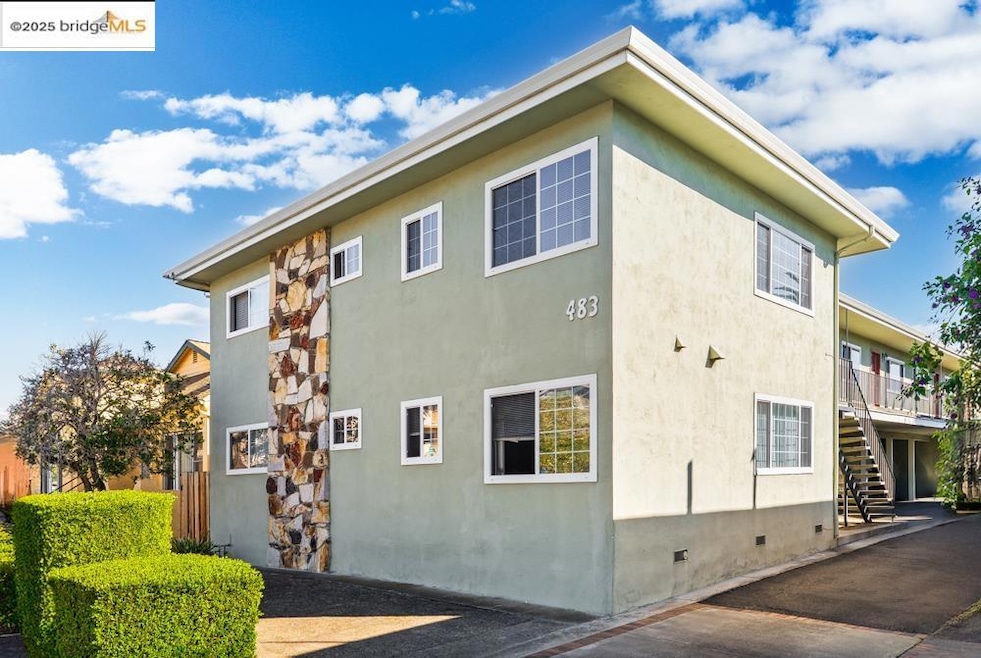


483 Joaquin Ave San Leandro, CA 94577
Estudillo Estates-Glen NeighborhoodEstimated payment $9,861/month
Highlights
- No HOA
- Cooling Available
- Heating Available
About This Home
$100K Price Improvement; www.483joaquin.com; Attractively located walking distance to Downtown San Leandro, this five unit multifamily property offers a mix of 3 bedroom, 2 bedroom, and 1 bedroom units. Recent exterior improvements include new roof, asphalt, lighting, gutters, railing screens, and new exterior facade and paint. Recent interior improvements include updated electrical panels in all units, new luxury flooring, updated lighting and ceiling fans, new blinds and appliances, and fresh interior paint. Added income is provided by new onsite coin operated laundry machines. Additionally, the property features 1:1 closed parking with potential for ADU conversion.
Property Details
Home Type
- Multi-Family
Year Built
- Built in 1964
Lot Details
- 7,200 Sq Ft Lot
Utilities
- Cooling Available
- Heating Available
Community Details
- No Home Owners Association
- Downtown San Lea Subdivision
Map
Home Values in the Area
Average Home Value in this Area
Tax History
| Year | Tax Paid | Tax Assessment Tax Assessment Total Assessment is a certain percentage of the fair market value that is determined by local assessors to be the total taxable value of land and additions on the property. | Land | Improvement |
|---|---|---|---|---|
| 2025 | $16,158 | $1,108,068 | $266,801 | $841,267 |
| 2024 | $16,158 | $1,086,346 | $261,571 | $824,775 |
| 2023 | $15,935 | $1,065,048 | $256,443 | $808,605 |
| 2022 | $15,489 | $1,044,165 | $251,415 | $792,750 |
| 2021 | $14,922 | $1,023,696 | $246,486 | $777,210 |
| 2020 | $14,504 | $1,017,098 | $243,960 | $773,138 |
| 2019 | $14,093 | $997,238 | $239,178 | $758,060 |
| 2018 | $13,773 | $977,765 | $234,489 | $743,276 |
| 2017 | $13,477 | $958,671 | $229,892 | $728,779 |
| 2016 | $12,811 | $939,954 | $225,385 | $714,569 |
| 2015 | $10,104 | $710,557 | $209,020 | $501,537 |
| 2014 | -- | $696,699 | $204,926 | $491,773 |
Property History
| Date | Event | Price | List to Sale | Price per Sq Ft |
|---|---|---|---|---|
| 02/11/2026 02/11/26 | Price Changed | $1,595,000 | -5.9% | $409 / Sq Ft |
| 11/21/2025 11/21/25 | For Sale | $1,695,000 | 0.0% | $435 / Sq Ft |
| 02/03/2025 02/03/25 | Off Market | -- | -- | -- |
| 01/25/2025 01/25/25 | For Rent | -- | -- | -- |
Source: bridgeMLS
MLS Number: 41117971
Disclaimer: Certain information contained herein is derived from information provided by parties other than Homes.com. All information provided is deemed reliable, but is not guaranteed to be accurate and should be independently verified.
![]() Bay East 2026. CCAR 2026. bridgeMLS 2026. Information Deemed Reliable But Not Guaranteed. This information is being provided by the Bay East MLS, or CCAR MLS, or bridgeMLS. The listings presented here may or may not be listed by the Broker/Agent operating this website. This information is intended for the personal use of consumers and may not be used for any purpose other than to identify prospective properties consumers may be interested in purchasing.
Bay East 2026. CCAR 2026. bridgeMLS 2026. Information Deemed Reliable But Not Guaranteed. This information is being provided by the Bay East MLS, or CCAR MLS, or bridgeMLS. The listings presented here may or may not be listed by the Broker/Agent operating this website. This information is intended for the personal use of consumers and may not be used for any purpose other than to identify prospective properties consumers may be interested in purchasing.
- 1550 Bancroft Ave Unit 112
- 308 Elsie Ave
- 962 Lee Ave
- 243 Chumalia St
- 225 Chumalia St
- 523 Pala Ave
- 65 Thornton St
- 270 Sybil Ave
- 277 W Juana Ave
- 1920 Bradhoff Ave
- 1599 Hays St Unit 306
- 576 Begier Ave
- 1400 Carpentier St Unit 315
- 2062 Washington Ave
- 400 Davis St Unit 301
- 1193 Glen Dr
- 970 Joaquin Ave Unit U7
- 1256 Glen Dr
- 84 Oakes Blvd
- 860 Superior Ave
- 424 Callan Ave
- 240 Chumalia St Unit 2
- 100 Callan Ave
- 100 Callan Ave Unit SI FL3-ID1952
- 100 Callan Ave Unit SI FL5-ID1941
- 100 Callan Ave Unit SI FL4-ID1940
- 100 Callan Ave Unit SI FL5-ID1938
- 100 Callan Ave Unit SI FL4-ID1931
- 1812 Washington Ave
- 70 Harlan St
- 235 Haas Ave
- 1675 Hays St
- 398 Parrott St Unit 104
- 153A Haas Ave
- 77-85 Estabrook St
- 2181 E 14th St
- 1600 Grand Ave
- 13475 Bancroft Ave
- 13495 Bancroft Ave
- 1308 Benedict Dr

Ask me questions while you tour the home.