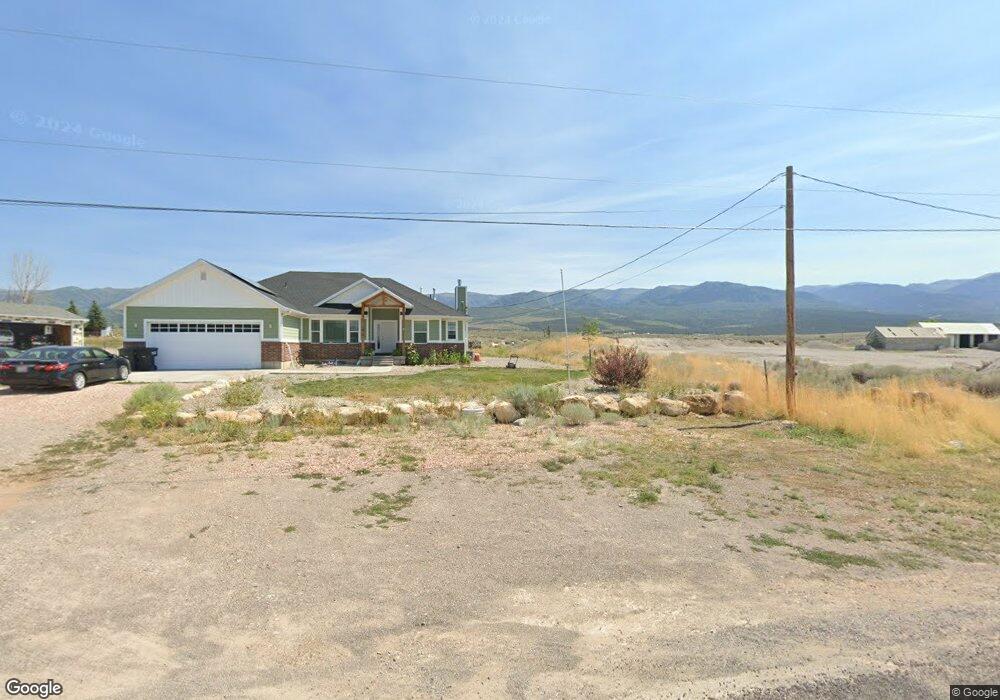
485 S 600 E Mount Pleasant, UT 84647
Estimated Value: $557,000 - $615,528
3
Beds
2
Baths
3,595
Sq Ft
$160/Sq Ft
Est. Value
About This Home
This home is located at 485 S 600 E, Mount Pleasant, UT 84647 and is currently estimated at $574,132, approximately $159 per square foot. 485 S 600 E is a home located in Sanpete County with nearby schools including North Sanpete High School and Wasatch Academy.
Ownership History
Date
Name
Owned For
Owner Type
Purchase Details
Closed on
Dec 26, 2019
Sold by
Earl and Ashlee
Bought by
Matthews Dennis E
Current Estimated Value
Home Financials for this Owner
Home Financials are based on the most recent Mortgage that was taken out on this home.
Original Mortgage
$280,000
Interest Rate
3.6%
Mortgage Type
Construction
Purchase Details
Closed on
May 25, 2016
Sold by
Desmond Philip R and Desmond Lynda
Bought by
Taylon Earl
Home Financials for this Owner
Home Financials are based on the most recent Mortgage that was taken out on this home.
Original Mortgage
$30,000
Interest Rate
4.2%
Mortgage Type
New Conventional
Create a Home Valuation Report for This Property
The Home Valuation Report is an in-depth analysis detailing your home's value as well as a comparison with similar homes in the area
Home Values in the Area
Average Home Value in this Area
Purchase History
| Date | Buyer | Sale Price | Title Company |
|---|---|---|---|
| Matthews Dennis E | -- | Central Title Co | |
| Taylon Earl | $37,500 | First American-Ephraim |
Source: Public Records
Mortgage History
| Date | Status | Borrower | Loan Amount |
|---|---|---|---|
| Previous Owner | Matthews Dennis E | $280,000 | |
| Previous Owner | Taylon Earl | $30,000 |
Source: Public Records
Tax History
| Year | Tax Paid | Tax Assessment Tax Assessment Total Assessment is a certain percentage of the fair market value that is determined by local assessors to be the total taxable value of land and additions on the property. | Land | Improvement |
|---|---|---|---|---|
| 2025 | -- | $311,686 | $0 | $0 |
| 2024 | -- | $296,758 | $0 | $0 |
| 2023 | $0 | $278,646 | $0 | $0 |
| 2022 | $938 | $248,792 | $0 | $0 |
| 2021 | $2,395 | $198,691 | $0 | $0 |
| 2020 | $2,252 | $170,304 | $0 | $0 |
| 2019 | $2,396 | $170,584 | $0 | $0 |
| 2018 | $2,198 | $269,698 | $44,666 | $225,032 |
| 2017 | $653 | $44,666 | $0 | $0 |
| 2016 | $439 | $30,000 | $0 | $0 |
| 2015 | $441 | $30,000 | $0 | $0 |
| 2014 | $450 | $30,000 | $0 | $0 |
| 2013 | $423 | $30,000 | $0 | $0 |
Source: Public Records
Map
Nearby Homes
Your Personal Tour Guide
Ask me questions while you tour the home.